Interactive Visualizations for Dynamic and Multivariate Networks. Free, online, and open source.
Use
VisualizationsFormatting Data
Importing Data
Troubleshooting
Resources
Chat (Discord)Mailing List
Demo Data
Other Tools
Project
PublicationsContribute
Team
Contact us
| Tours | User Interface | Help & Support |
Guided Tours with Network Narratives
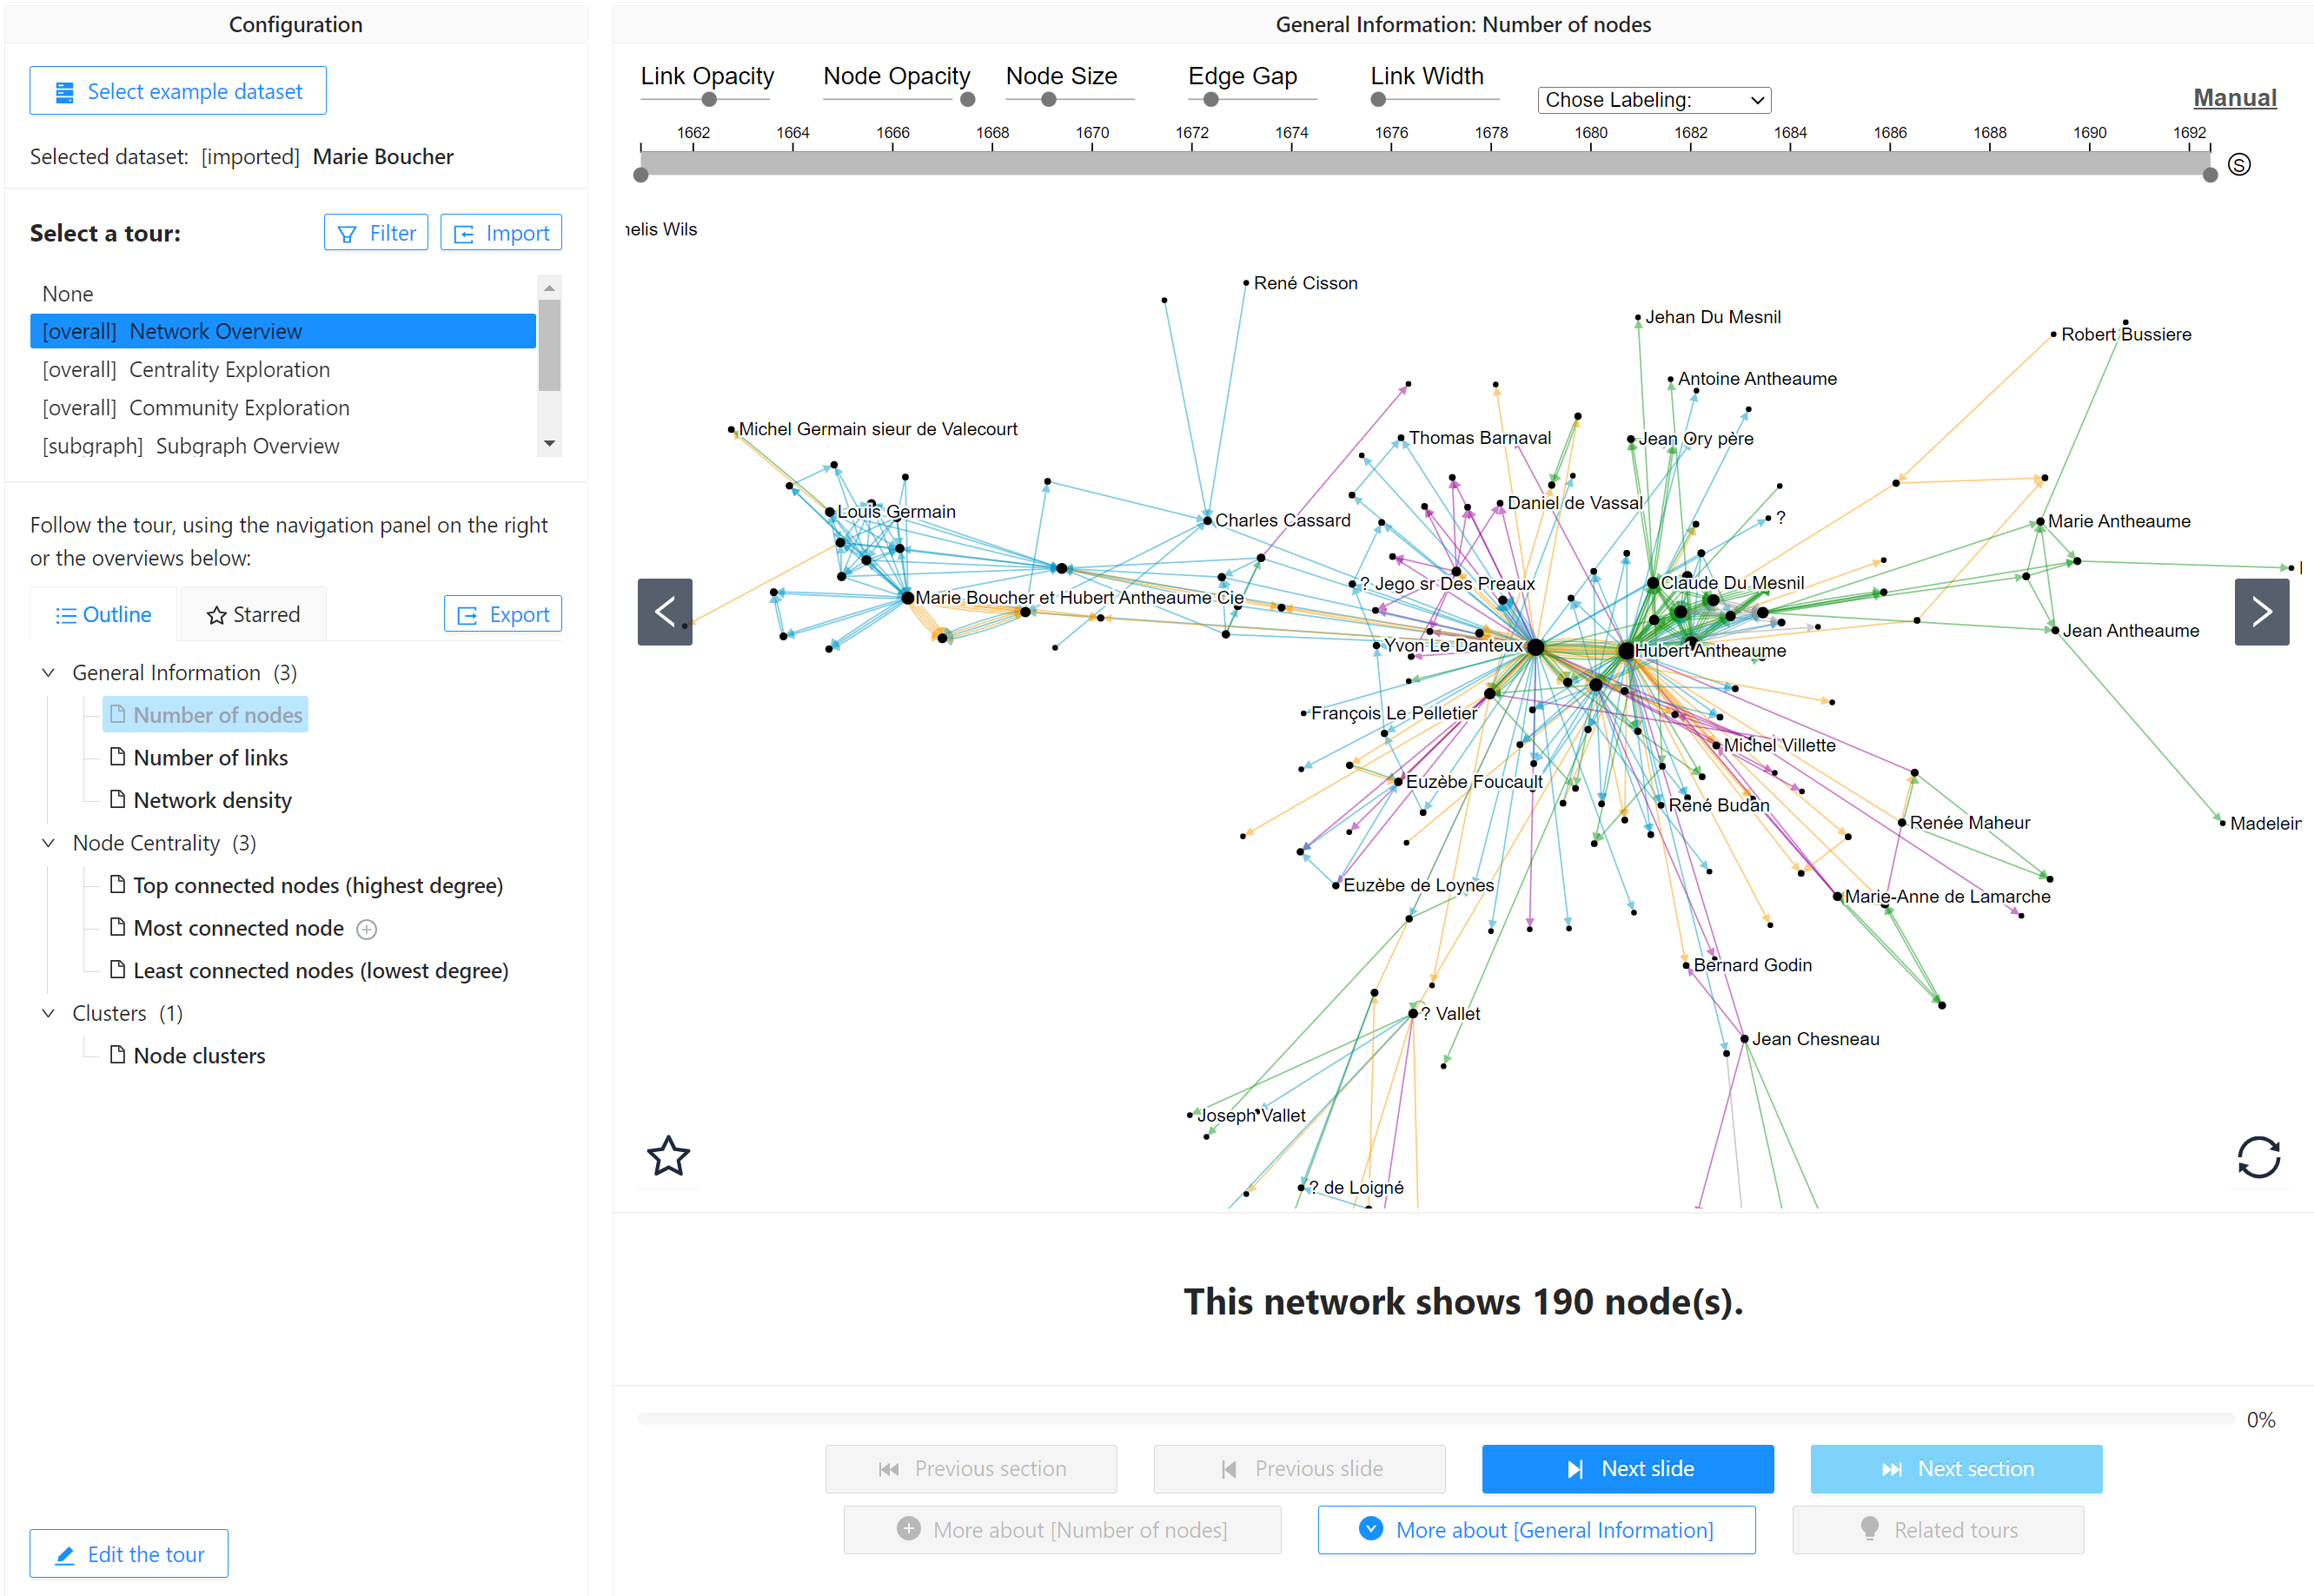
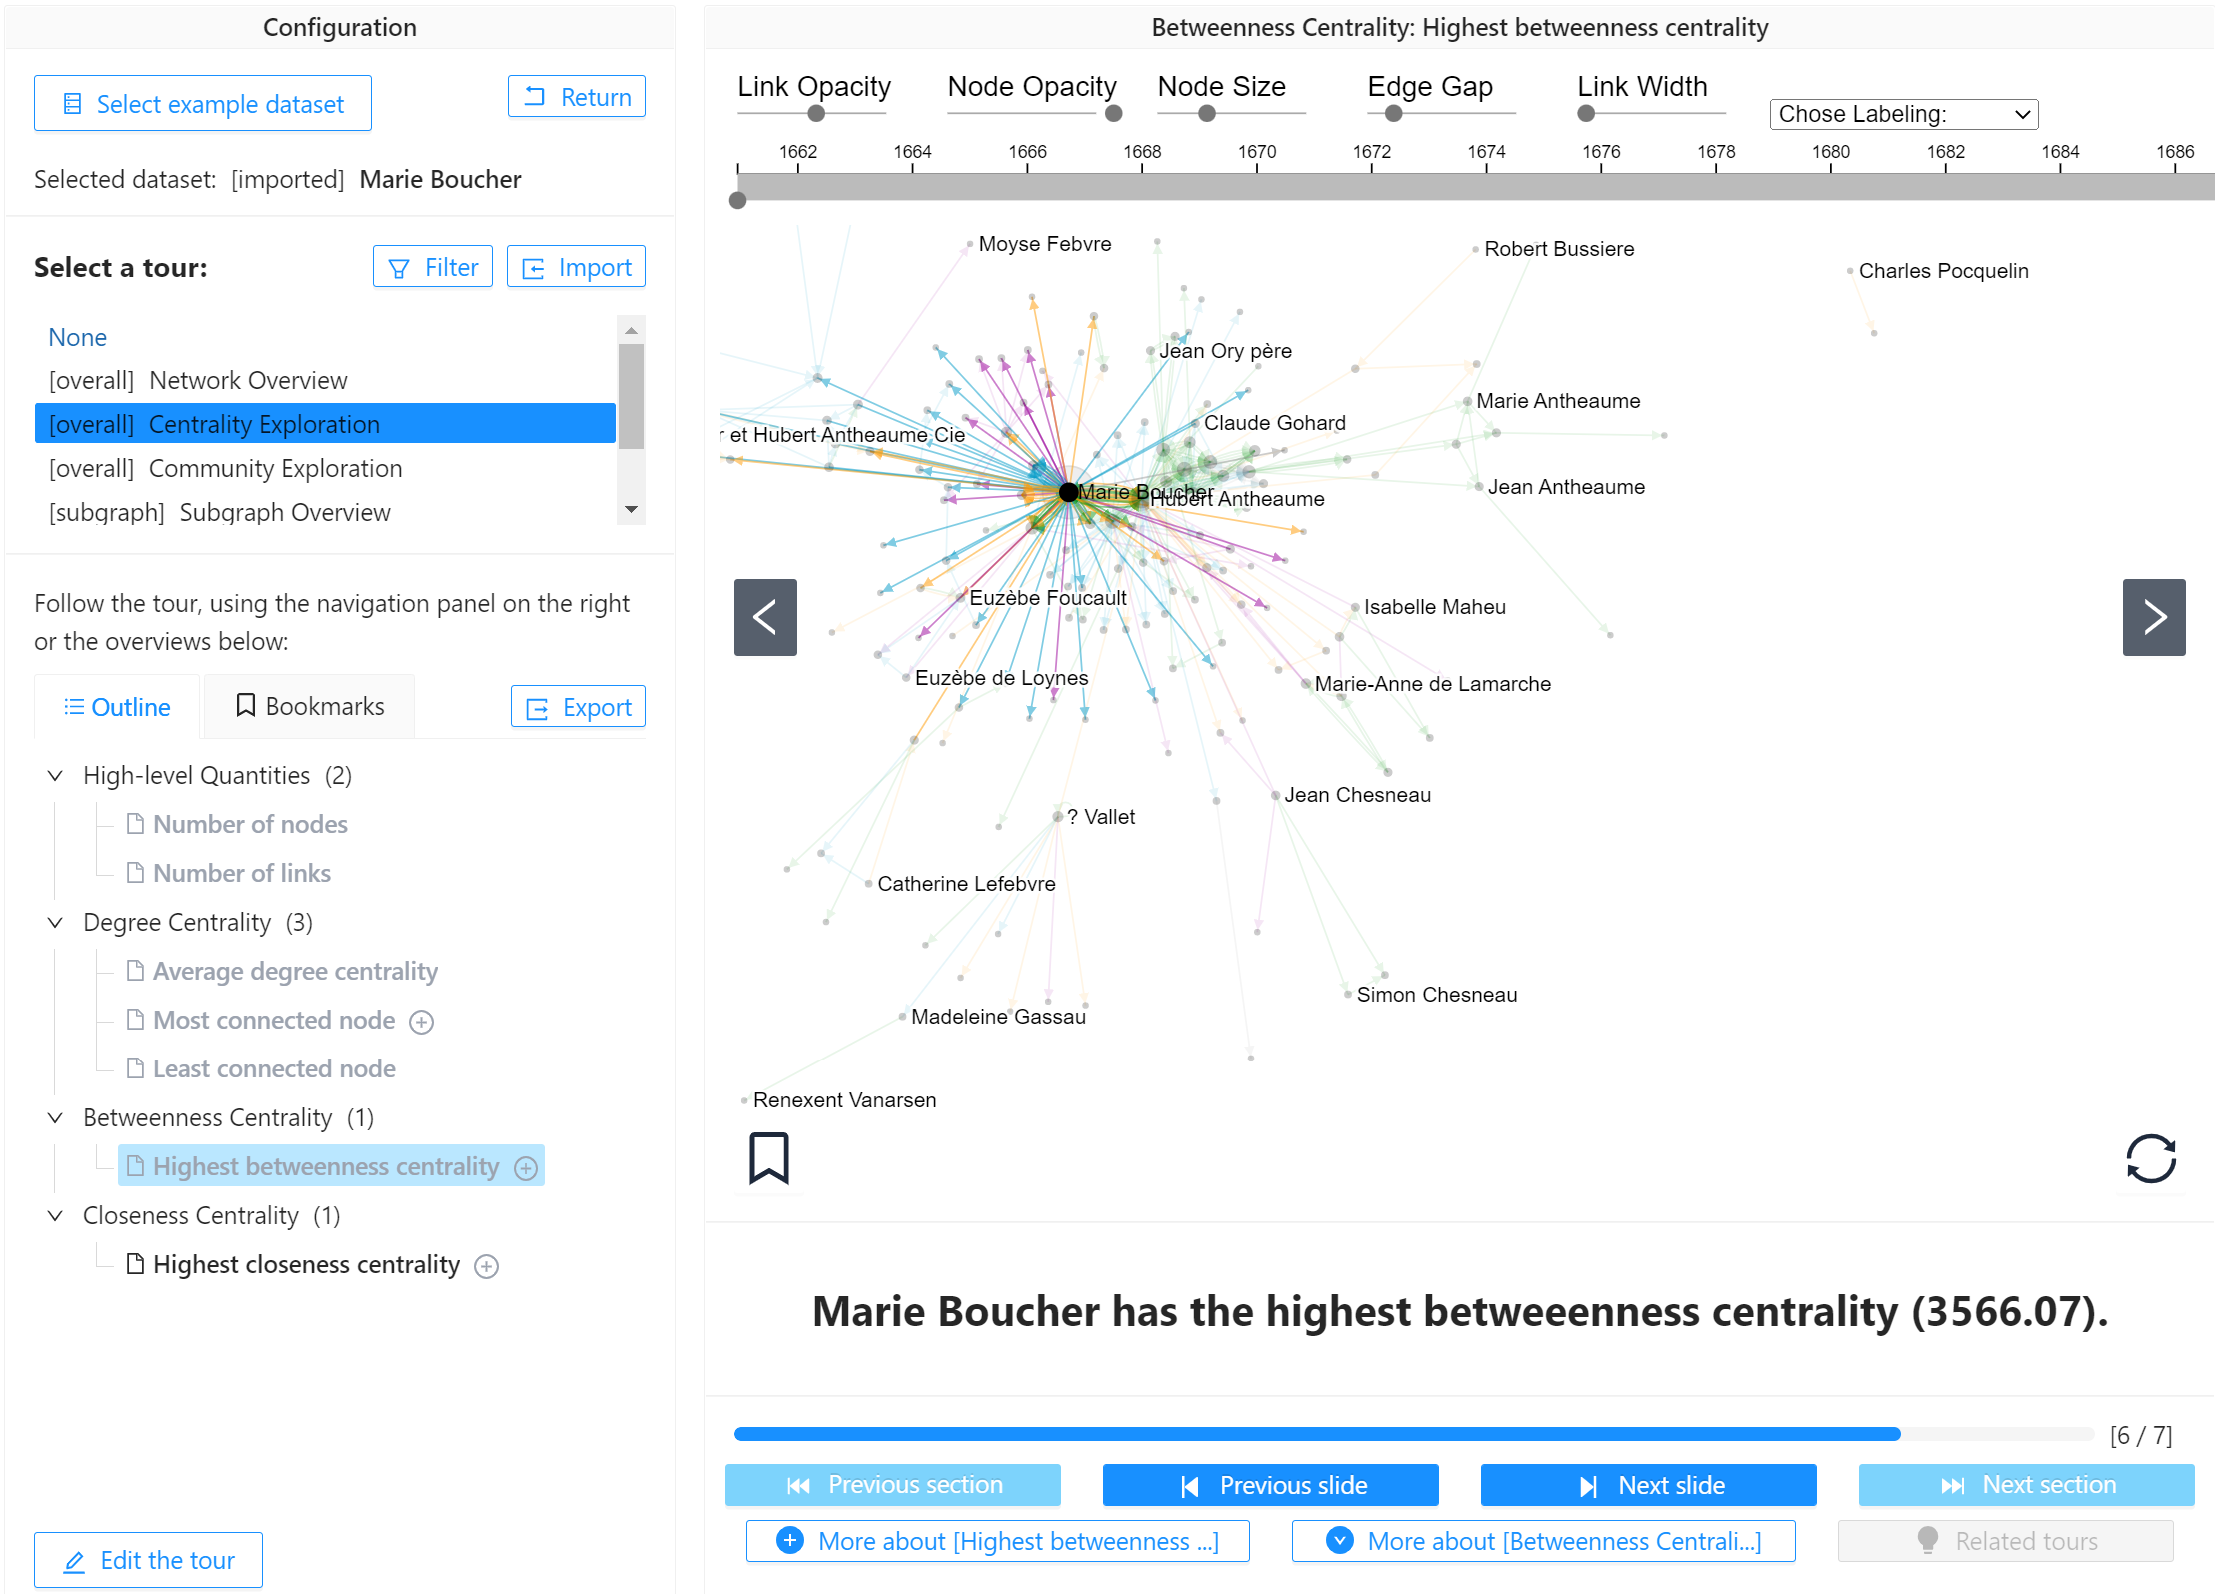
NetworkNarratives is a Vistorian modules that provides a set of automatically generated guided tours in the form of annotated slideshows to help you exploring your network. Chosing from a set of tours (e.g., Network Overview, Egonetwork Exploration, etc.), NetworkNarratives creates a slideshow with text captions as if someone would give you talk about your network. With simple linear navigation (next slide, previous slide), you can navigate the slideshow and learn about your network.
» Watch the video (3:29)
Launching Network Narratives
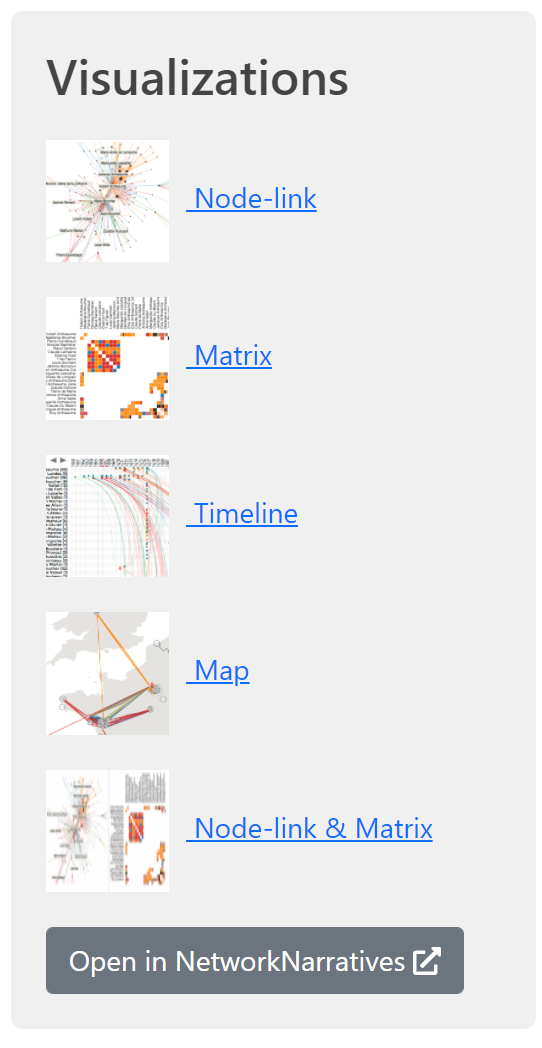
You can launch NetworkNarratives direclty from The Vistorian side menu where you launch the individual visualizations.
Tours
A tour in Network Narratives is best imagined as a slide-deck. Each slide tells you something about your network. A tour consists of
- slides, showing a single fact about your network (e.g., a piece of information such as the most connected node, or the network density), and
- sections, grouping slides of a specific topic (e.g., centrality measures).
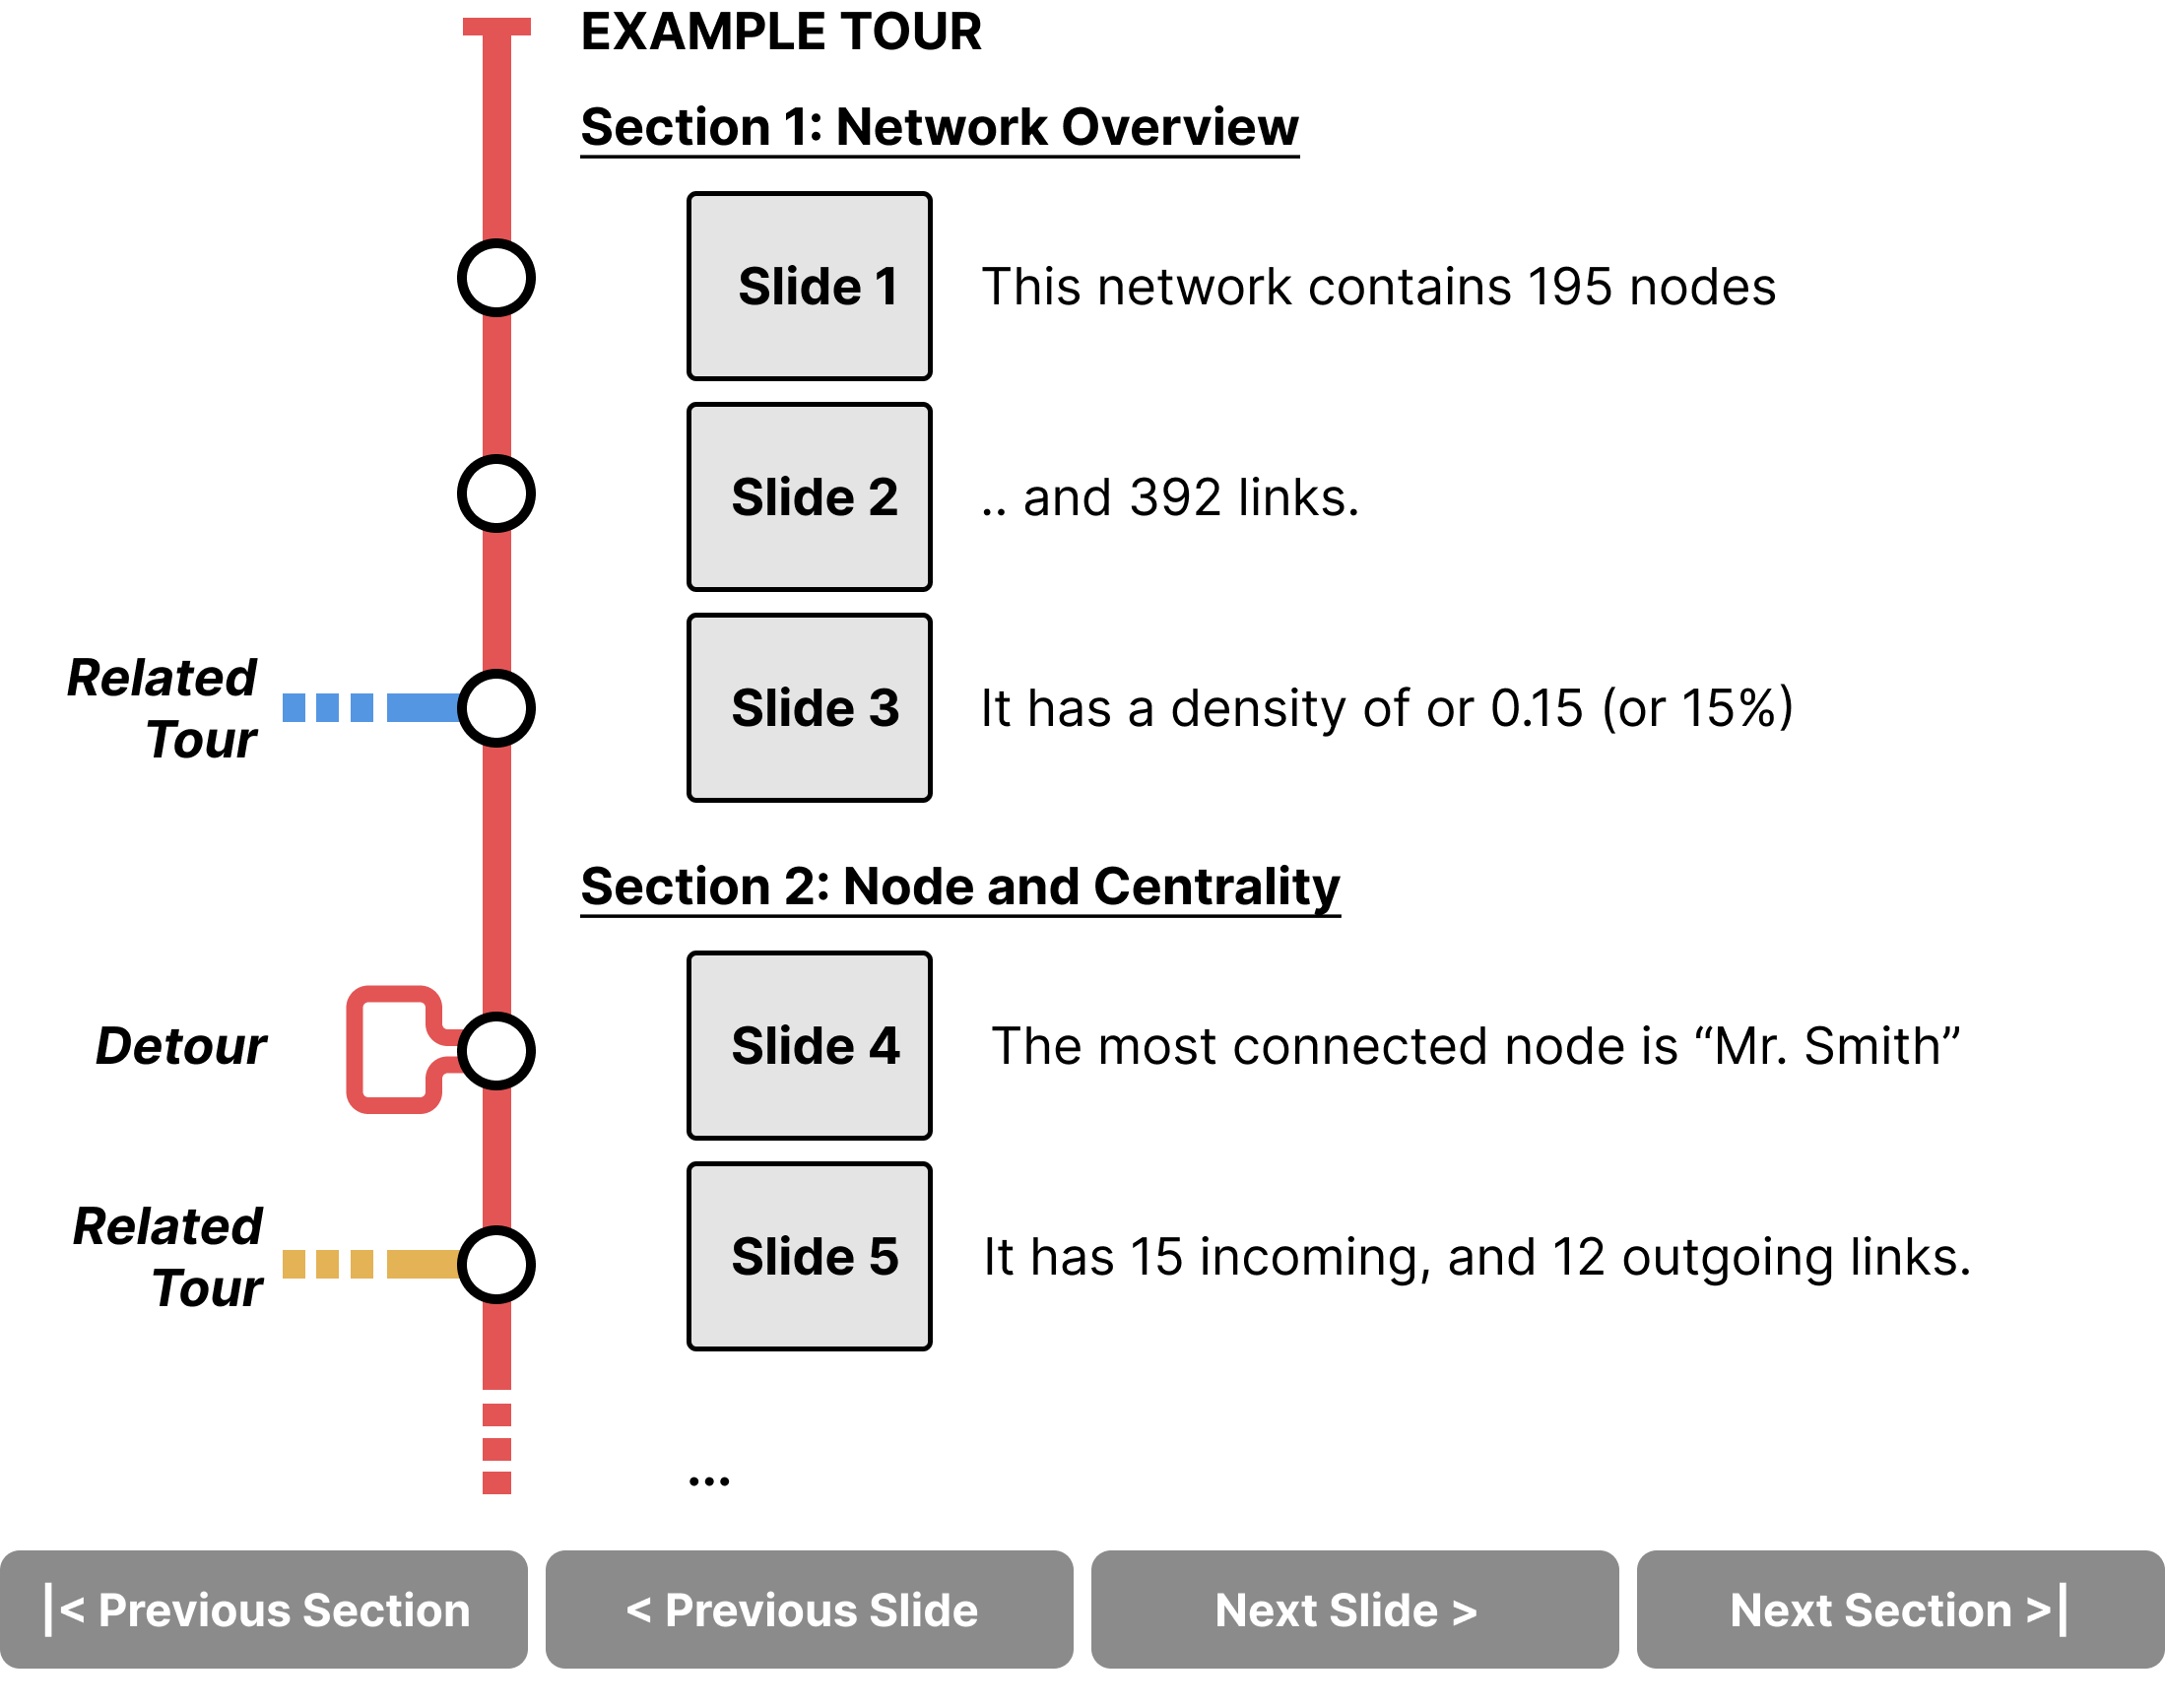
Slides in a tour are calculated by Network Narratives once a tour has been selected.
You can use the Navigation Bar to navigate between slides.
- Some slides propose detours, i.e., by including similar slides on demand, e.g., to learn more about a specific topic fact shown on a slide.
- Other slides link to related tours, e.g., to learn more about the ego network of a node mentioned at that slide.
Find out which tours Network Narratives provides with.
User Interface
Learn more about the user interface here.
Help & Support
Get in touch to schedule a 1-1 session to help you get set with your data. A Partcipant Information Sheet is optional if you would like to support our research and can be found here.