Interactive Visualizations for Dynamic and Multivariate Networks. Free, online, and open source.
Use
VisualizationsFormatting Data
Importing Data
Troubleshooting
Resources
Chat (Discord)Mailing List
Demo Data
Other Tools
Project
PublicationsContribute
Team
Contact us

Troubleshooting
If you experience technical issues or bug, please check this site or let us know which problems you encounter: (vistorian@inria.fr).
Issues related to Data Formats and Dataset Filename:
- Filename should not include special characters nor be lengthy.
- Id column should start with zero ‘0’ not ‘1’.
- Dates in the date column should be consistent. Meaning that all cells in the date column should be in the same format.
Browser:
The Vistorian is optimized for Chrome. Through other browses might work well, e.g. Mozilla Firefox, visualizations might not show as expected as each browser interprets website a little differnetly. Chrome is small, fast, free, and runs on all major platforms: https://www.google.com/chrome.
Matrix and Time Arcs shown offset:
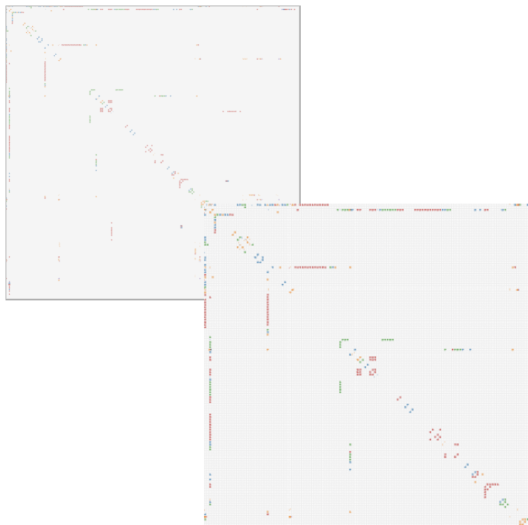
We have observed this on some Windows laptops, including Microsoft Surface. To solve this, go to Preferences/Settings (click the three dots in the top right of Chrome):

Then, set zoom to something smaller or higher than 100% (e.g. 67%, or 80%). Try different values and see if the matrix shows as below.
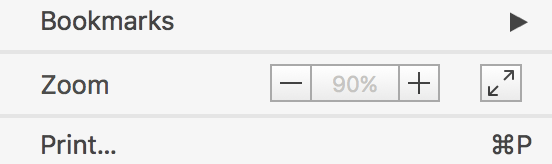
Your matrix should look like this with the labels clearly visible.
Chrome Crashes:
If Chrome crashes or the site is unresponsive for a while, the browser cache might be full. This can have two reasons:
- Your network is too large (> 5000 links), or
- You have too many networks and data imported into the Vistorian.
You have several ways to solve these issues:
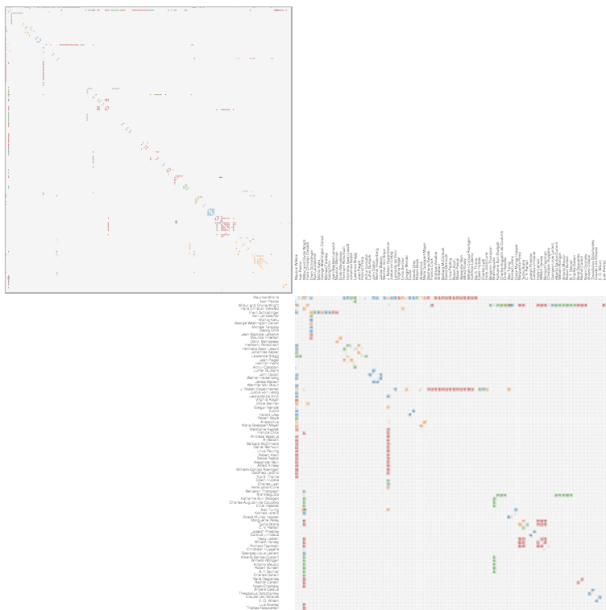
-
Remove networks and tables in your DataView. Click the x, next to the network(s) in the Network and Data Tables list:
-
If this doesn’t solve the problem, try the Empty browser cache button. This will flash the Vistorian’s browser cache. You will loose any data table and network imported into the Vistorian.