Interactive Visualizations for Dynamic and Multivariate Networks. Free, online, and open source.
Use
VisualizationsFormatting Data
Importing Data
Troubleshooting
Resources
Chat (Discord)Mailing List
Demo Data
Other Tools
Project
PublicationsContribute
Team
Contact us


The Vistorian
The Vistorian is an online tool for interactive exploration of dynamic, multivariate, and geographic networks.
Marie Boucher Dataset Explored Using The Vistorian, courtesy of Dr. Nicole Dufournaud
Interactive exploration means to discover and scrutinize your data through interactive queries and multiple complementary perspectives (visualizations). The idea of exploratory data analysis (EDA) goes back to the American statistician John Tukey.
The Vistorian is an active research project at the Vishub at the University of Edinburgh and Inria, France. The Vistorian is free to use by everyone. If you’re using the Vistorian for work, please cite our poster and send us feedback and examples of your work of our gallery. This helps us keeping the Vistorian funded. Similarly, if you find bugs, send us screenshots and descriptions, we’re happy to help you with your data. The Vistorian is open source.
» Launch the Vistorian
We are currently working an updated version Vistorian 2.0 (release mid Jan 2022) with:
- an easier data uploading routine, and
- updated visualization features.
Why the Vistorian?
The Vistorian provides four interactive visualizations to help explore networks:

- Node-link diagram: shows networks in the traditional force-directed layout. This visualization is a great start to gain an overview and see the network changing over time.
- Adjacency matrix: shows your network in a compact table format to help visulize very dense networks. It allows you understand clusters using differnet matrix serialization methods.
- Timeline: shows you network over time to track frequency and pace of connectivity in your network.
- Map: shows your network on an interactive map.
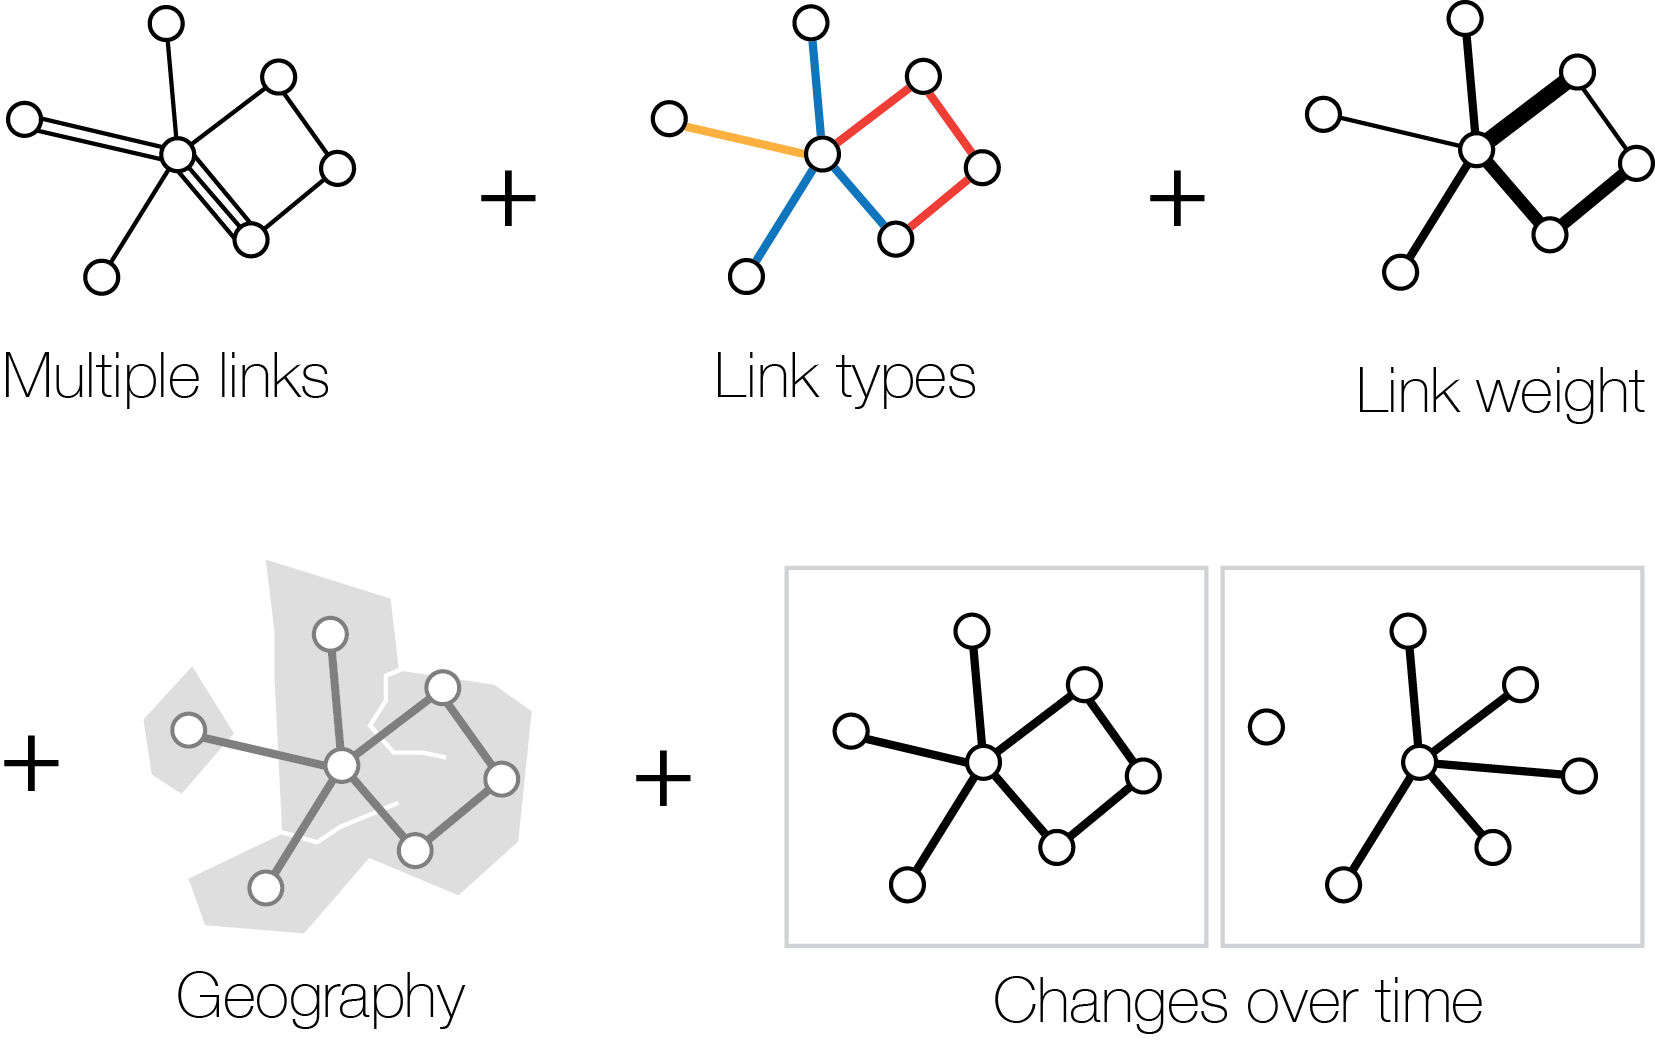
What kinds of networks does it visualize?
The Vistorian provides visualiztions for the following data in networks:

Upload data in simple CSV
Your data needs to be formatted in tables like shown below. All your data will remain securly on your machine. No data will be send to our server.

Learn more about formatting data for The Vistorian.
Learn
We provide detailed tutorials as well as a live workshops.
Join
- Join our mailing list: vistorian-community.
Cite The Vistorian
Benjamin Bach, Nathalie Henry Riche, Roland Fernandez, Emmanoulis Giannisakis, Bongshin Lee, Jean-Daniel Fekete. NetworkCube: Bringing Dynamic Network Visualizations to Domain Scientists. Posters of the Conference on Information Visualization (InfoVis), Oct 2015, Chicago, United States. 2015.
Support
The Vistorian is an ongoing research project. It is open source. If you wish to contribute or find issues, get in contact with us.
- Contact: vistorian@googlegroups.com