Interactive Visualizations for Dynamic and Multivariate Networks. Free, online, and open source.
Use
VisualizationsFormatting Data
Importing Data
Troubleshooting
Resources
Chat (Discord)Mailing List
Demo Data
Other Tools
Project
PublicationsContribute
Team
Contact us

Tutorial:Loading Data
This small tutorial will walk explain how to load data and visualize them. The demo network (see below) is a social network based on letter correspondences. The following walks through:
- how the data is formatted
- How to import data, and
- how you can explore it using the various interactive visualizations
Network representation of the data
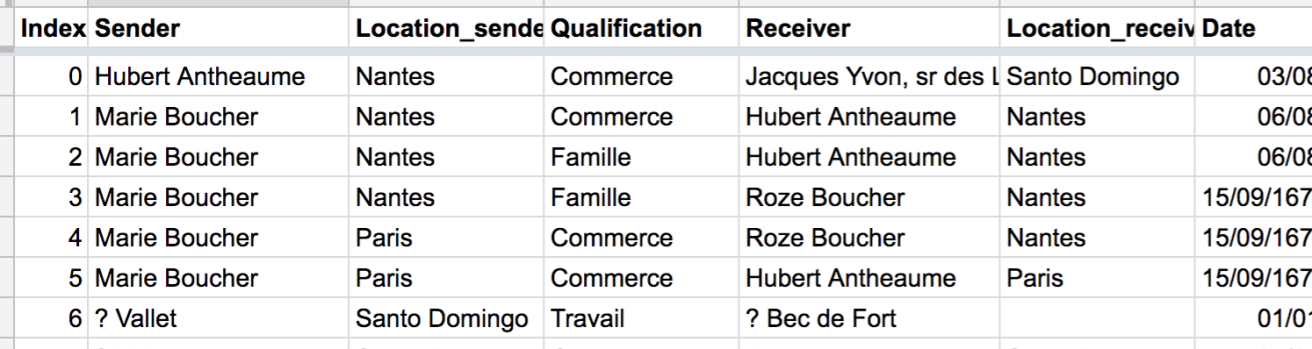
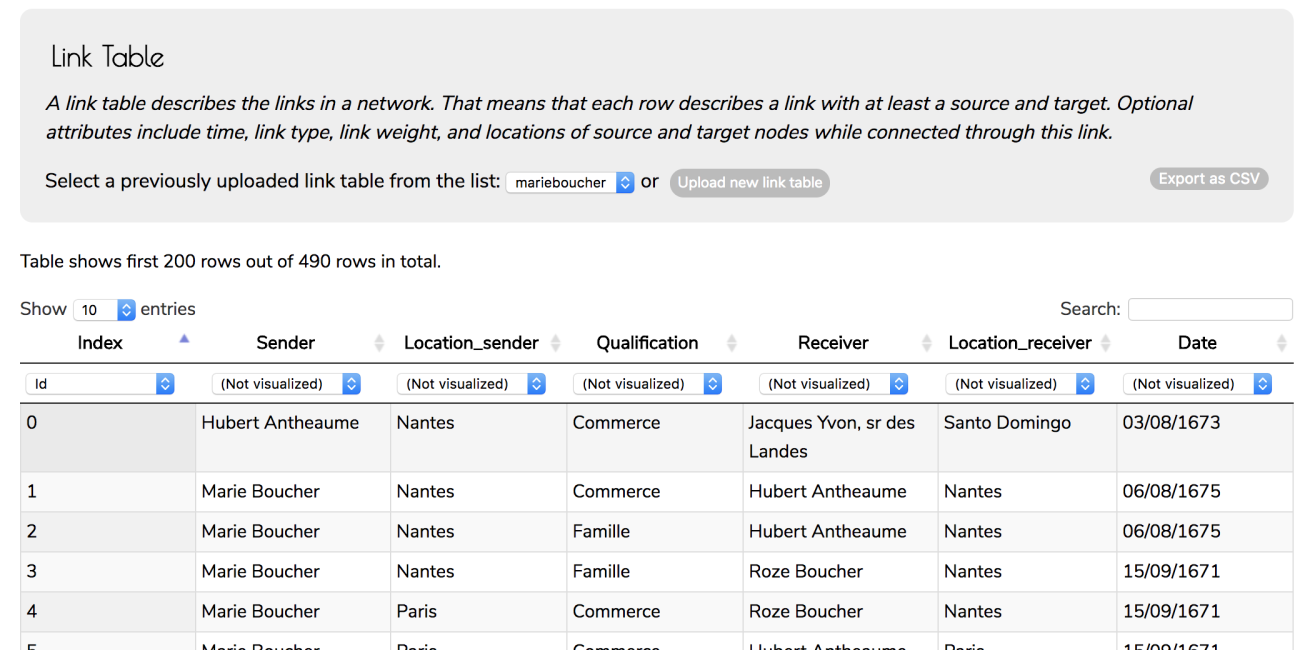
The input data file marieboucher.csv is an edge list format. All files imported into Vistorian must be in csv format. This means that each row is representing an edge (or relationship) between a pair of nodes.
Our file has the following columns:
- Sender: the node sending a letter
- Location_sender: the location the sending person was when writing the letter
- Receiver: the person receiving the letter
- Location_recipient: the location the receiving person was when receiving the letter
- Qualification: a type of letter, i.e. content.
- Date: the date the letter was written (sent).
Opening the file in google sheets or Excel shows the following:
For more information on data formatting and tables in Vistorian, see here.
Import data
This section explains how to import (load) data into the Vistorian. The Vistorian will not upload any of your data onto any server. Instead, the data is stored in your browser and can be deleted by flashing the browser cache (https://www.technipages.com/google-chrome-clear-cache). Data is stored persistently for after reopening the browser and restarting your machine.
-
Open Google Chrome and get to http://vistorian.net

-
To explore a new network or continue with a previously imported one, click on ‘My Session’ at the top of the home page (symbol has changed).
-
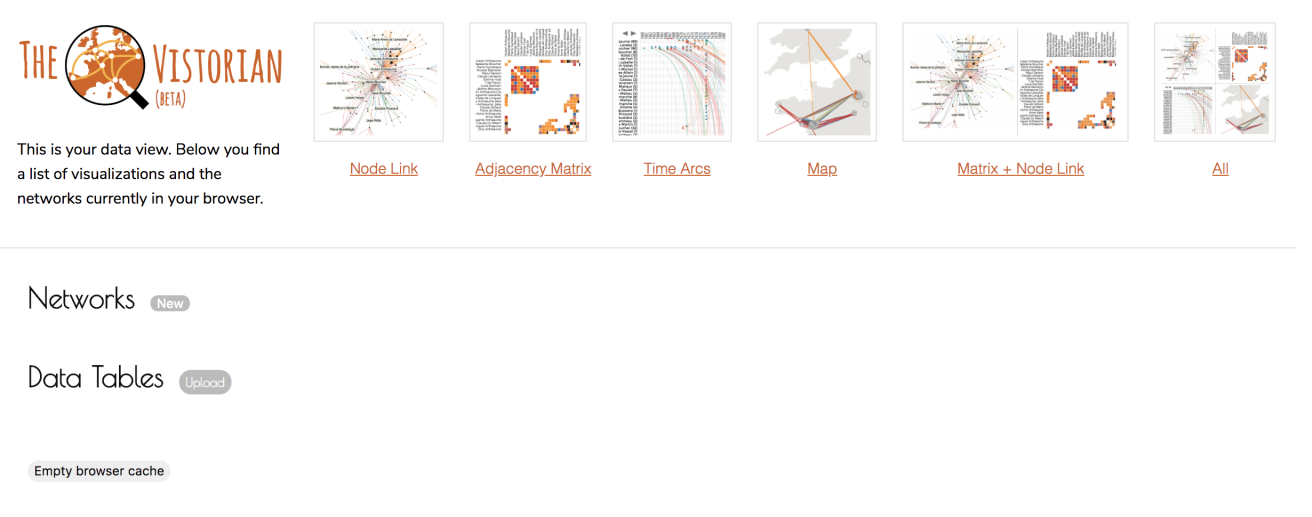
A new tab will open in your browser with the Data view. This view is your main platform for managing your uploaded data. On the left you see two lists: networks and tables. The Network list contains your networks, the table list contains an entry for every data file you uploaded. (some networks can consist of more than two tables; and the same table can be used across several networks.). On the top, you see links to the respective visualizations.

-
To upload data for a new network, click the ‘new’ button next to the Network list. This will initiate an empty network. The text on the orange background tells you that your network is not ready for visualization yet. You also see two gray boxes labeled NodeTable and and LinkTable.
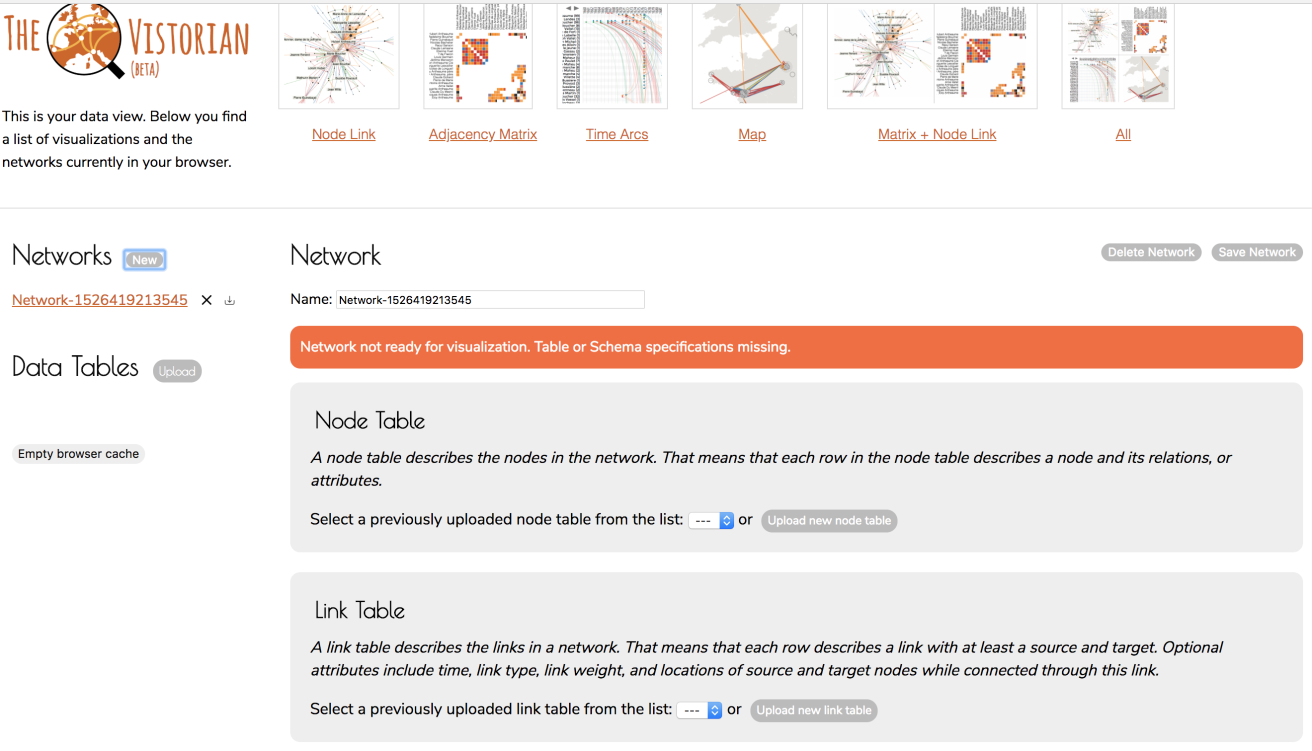
-
Since our demo data is in link table format, click no the ‘Upload new link table’ button and ignore the NodeTable box. Clicking the button opens a menu where you can select the downloaded marieboucher.csv file. Upon upload, the following table appears:
-
Now, you need to tell the Vistorian how to interpret that data. Therefore, select the corresponding meanings for each column from the dropdown menus above the columns:
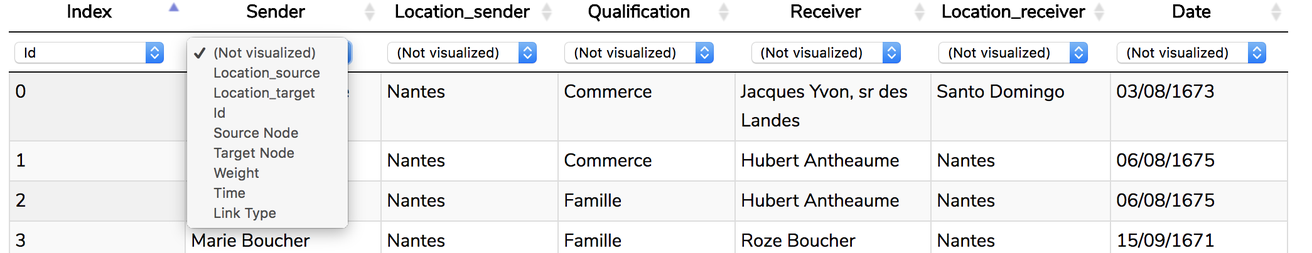
In this example, select the following mappings:
- Sender -> Source Node
- Location_sender -> Location_source
- Qualification -> Link Type
- Receiver -> Target Node
- Location_receiver -> Location_target
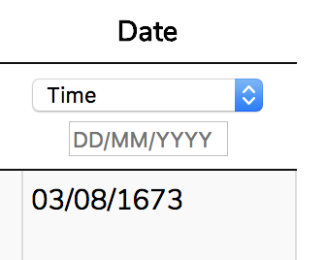
- Data -> Time
When you assigning the Date field, Vistorian asks you to specify the time format used in the file. This demo file uses DD/MM/YYYY.
-
Making a network in The Vistorian is as simple as that. You will notice that the message at the top of this page which earlier was coloured orange is now coloured green, stating we are ready for looking at the data.
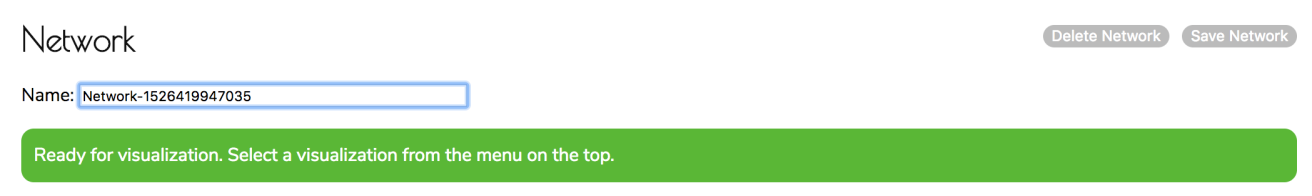
-
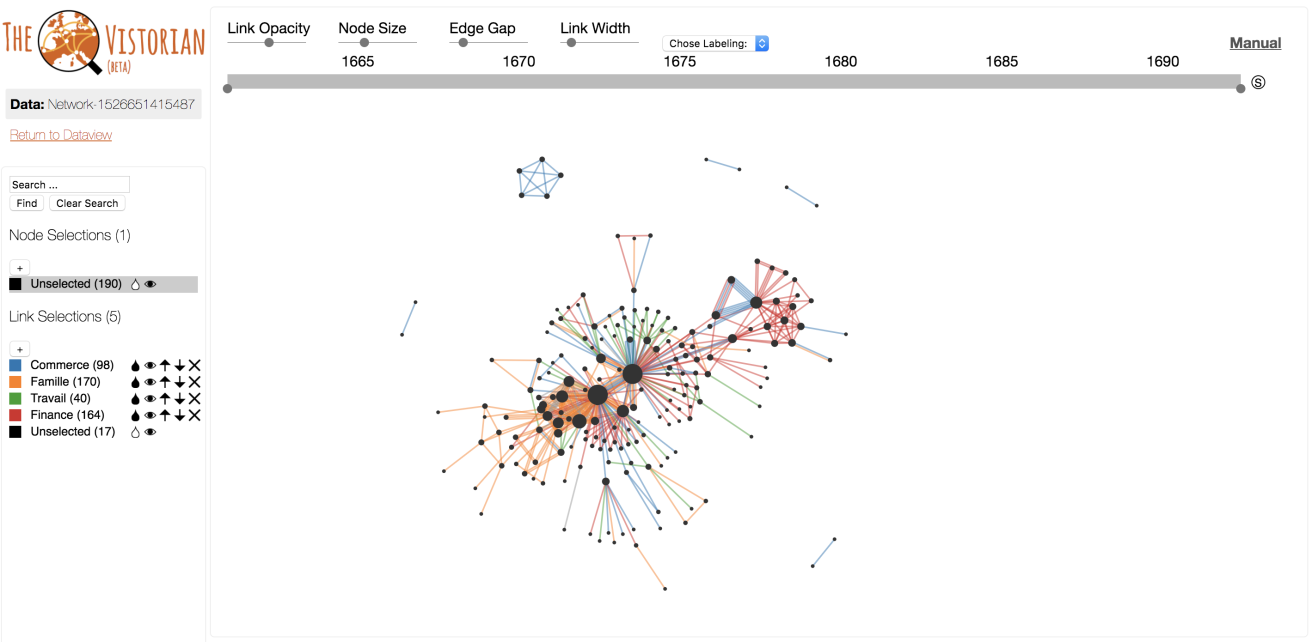
We can first choose to give our network a particular name if we wish by modifying the title in the ‘Name’ box at the top of the page and clicking ‘Save Network on the top right. Now, click on the Node Link and check if you see the network in the new tab that opens.
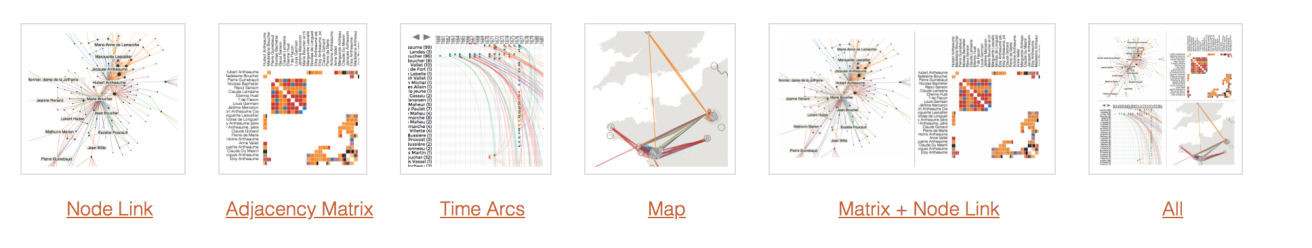
A new tab should open, showing the network like this: