Interactive Visualizations for Dynamic and Multivariate Networks. Free, online, and open source.
Use
VisualizationsFormatting Data
Importing Data
Troubleshooting
Resources
Chat (Discord)Mailing List
Demo Data
Other Tools
Project
PublicationsContribute
Team
Contact us

Tutorial: A Step-by-Step Guide to Create your First set of Visualizations and Bookmarks
-
Make your dataset ready: Now you are set to start using the Vistorian along with the bookmarks and states: For testing purposes you can use the MarieBoucher.csv file, a demo dataset, or any dataset of your own.
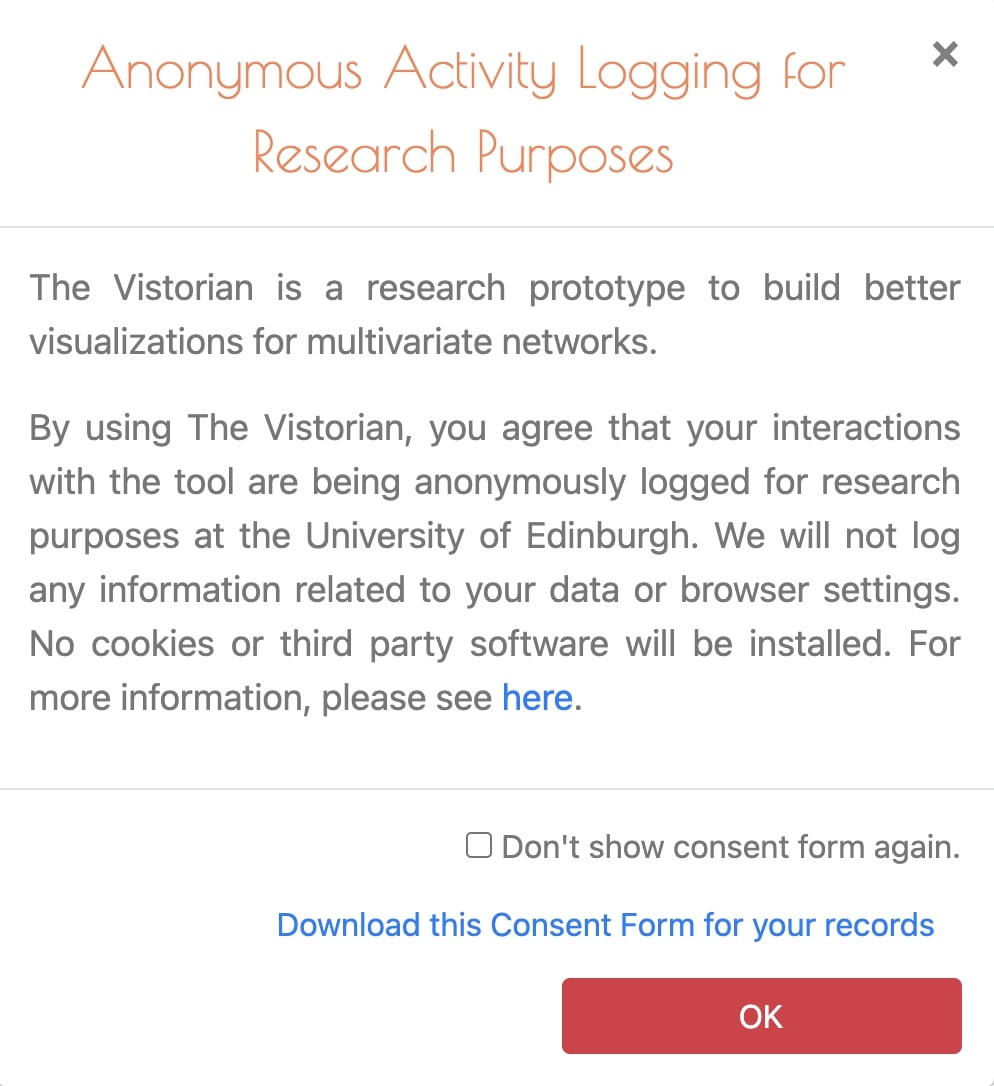
- Go to The Vistorian. The consent form will appear:
- Check on [Don’t show consent-approval form again] if you wish not to see it again.
- Download a copy of the consent form by clicking on the download link [Download this Consent Form for your Records].
-
By clicking the ‘OK’ button, you accept the consent. Please refer to the consent and for further details about what we annonymously log refer to study page
- Start using VistorianLab: In the home page click on [My Session]. The link will open a new window with the data view page.
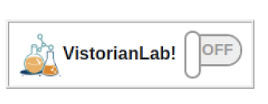
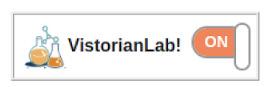
Switch on the [VistorianLab toggol] button on the left side to start creating and using bookmarks.
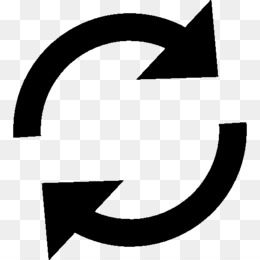
 ⇒
⇒ 
- Note: in the dataview page, you will not be able to create any bookmark as there aren’t any states to be captured/restored.
-
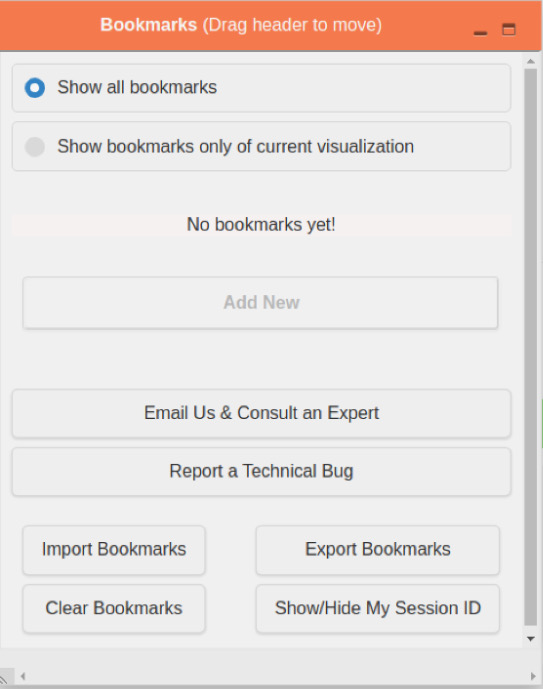
The bookmarks pane will show-up: As a start it will show the message of (No bookmarks yet!). You can minimize it if you wish to.
- Create a new network: Now, create a new network by clicking on the [New] button next to [Networks] section on the left side of the screen.(L)
- Under the Link Table: click on the [upload new link table] button and select the file of MarieBoucher.csv (L)
- In Link Table part:
- Describe your data by choosing the correct type for each column from the table header. From the drop-down menu select description of each column as following:
- For [Name 1] column: select [Source Node] from the dropdown menu at the top of the table.
- For [Name 2] column: select [Target Node] from the dropdown menu at the top of the table
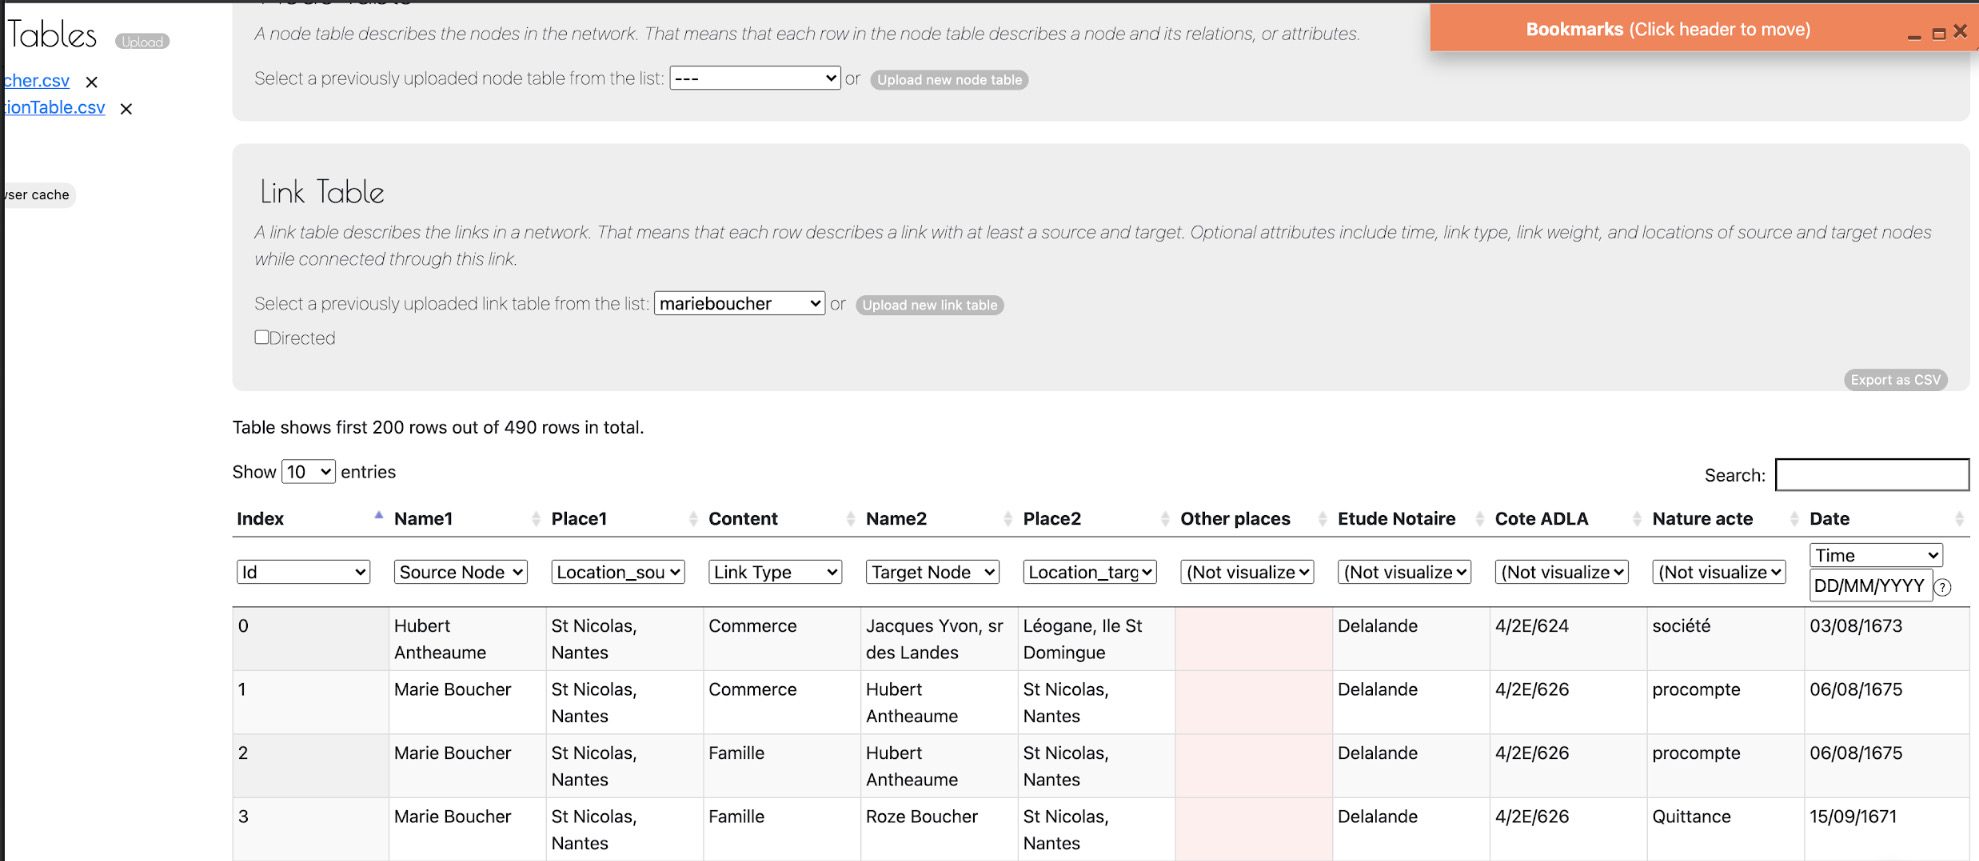
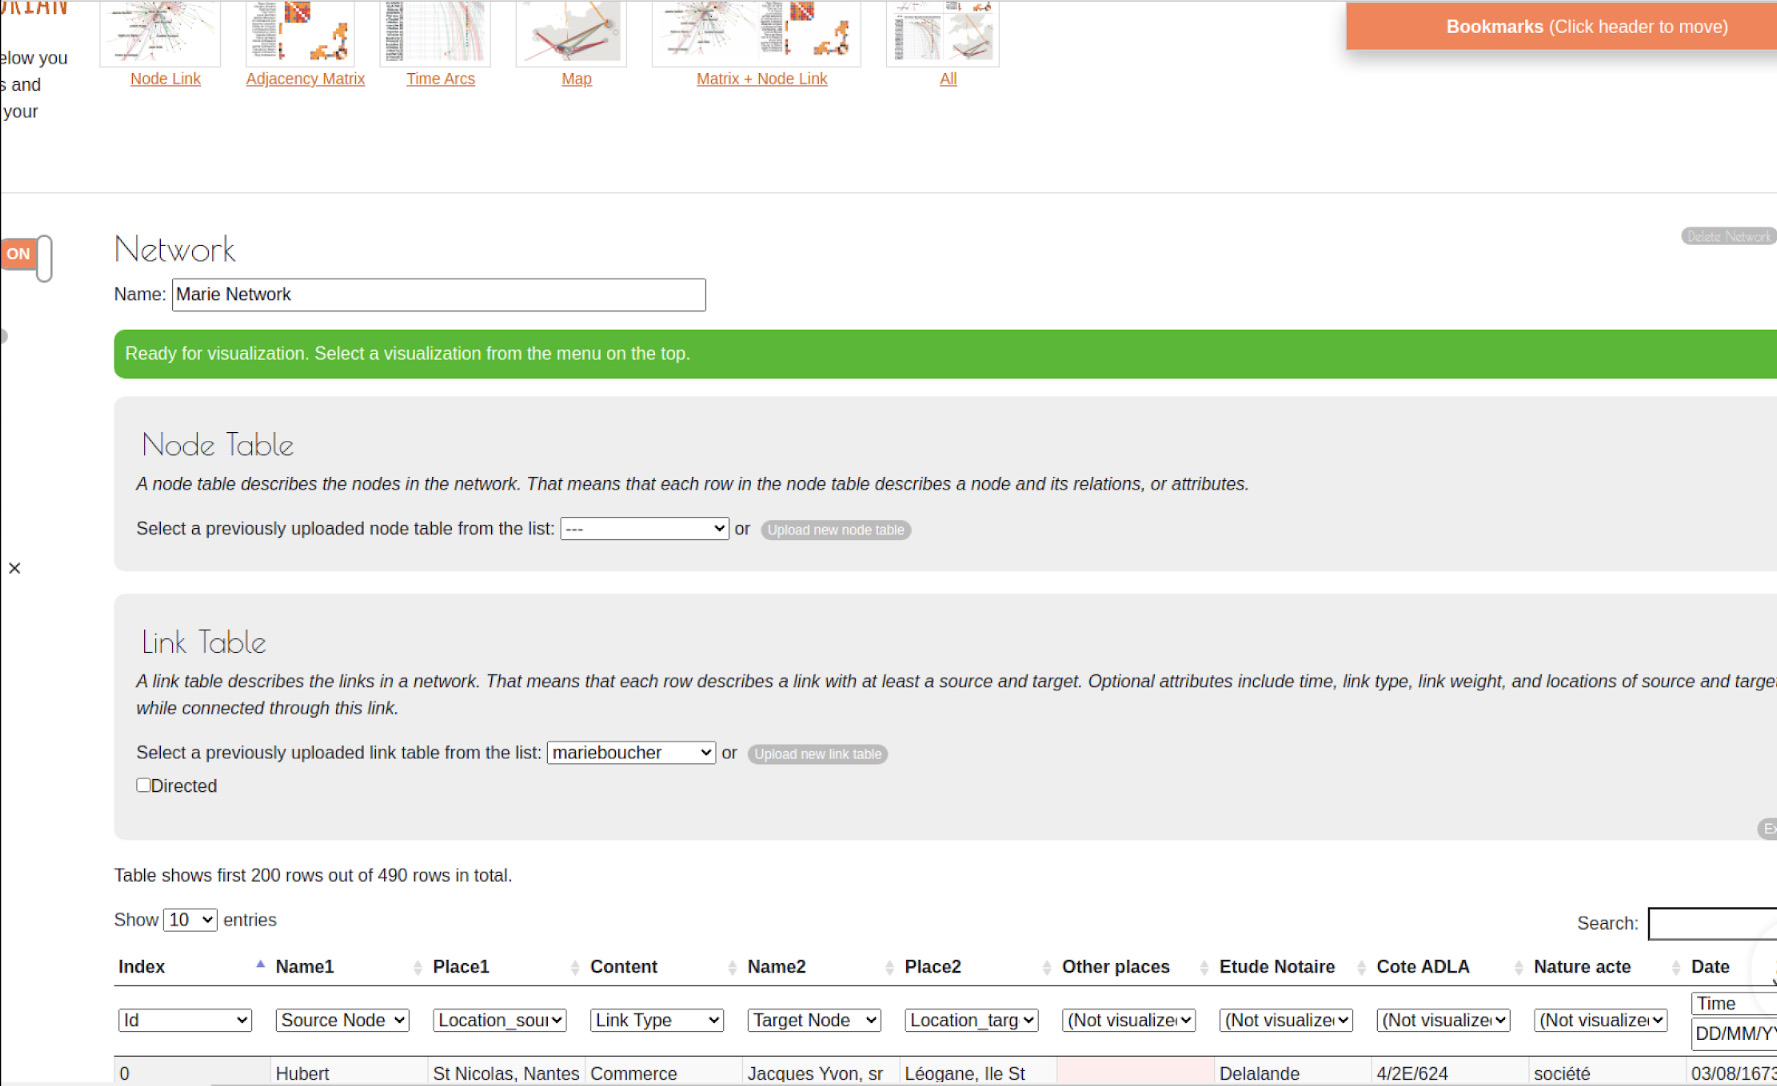
As soon as you specify the source and target nodes, a green bar will show stating (Ready for visualization. Select a visualization from the menu on the top.)
Now, continue by specifying the rest of the columns as following:
- For [Content] column: select as the [Link Type] from dropdown menu at the top of the table
- For [Place 1] column: select as the [Location Source] from dropdown menu at the top of the table
- For [Place 2] column: select as [Location Target] from dropdown menu at the top of the table
- For [Date] column: select as the [Time] from dropdown menu at the top of the table, then specify the date format: DD/MM/YYYY
- Describe your data by choosing the correct type for each column from the table header. From the drop-down menu select description of each column as following:
-
Save the network by clicking the [Save Network] button on the top right.
No personal data will be tracked. All personal files will be saved in your browser’s cache memory. Once you close your browser, your Vistorian pages/files will last in your browser’s memory until they are erased by you. Files can be erased from your browser’s local memory by clicking on the [Empty browser cache] button located on the data view page. (L)
- Changing the network name: update the network name with any name of your choice (e.g. Marie Network) and click on [Save Network] button on your right side of the screen (L).

- You must click on the [Save Network] button before creating the visualizations. If you don’t click on the [Save Network] button, your data might not be stored correctly. That is once you upload your data, the data will be shaped in a format that allows it to be visualized correctly. Thus, to ensure that the data’s format and/or any changes the user has made to the data/network has been stored correctly. The user should click the [Save Network] button.
- Create Node-Link network: Now, we can create any visualized network by clicking on any of the icons at the upper toolbar. Select the type(s) of the visualizations/networks you would like to explore/display. You can create multiple visualizations at the same time.(L)
- Now, we can create any visualized network by clicking on any of the icons at the upper toolbar. (e.g. Node link, matrix, ..)
- As start, click on the (Node Link) visualization icon on the upper part of the screen. This will open the new window of the Node Link visualization.
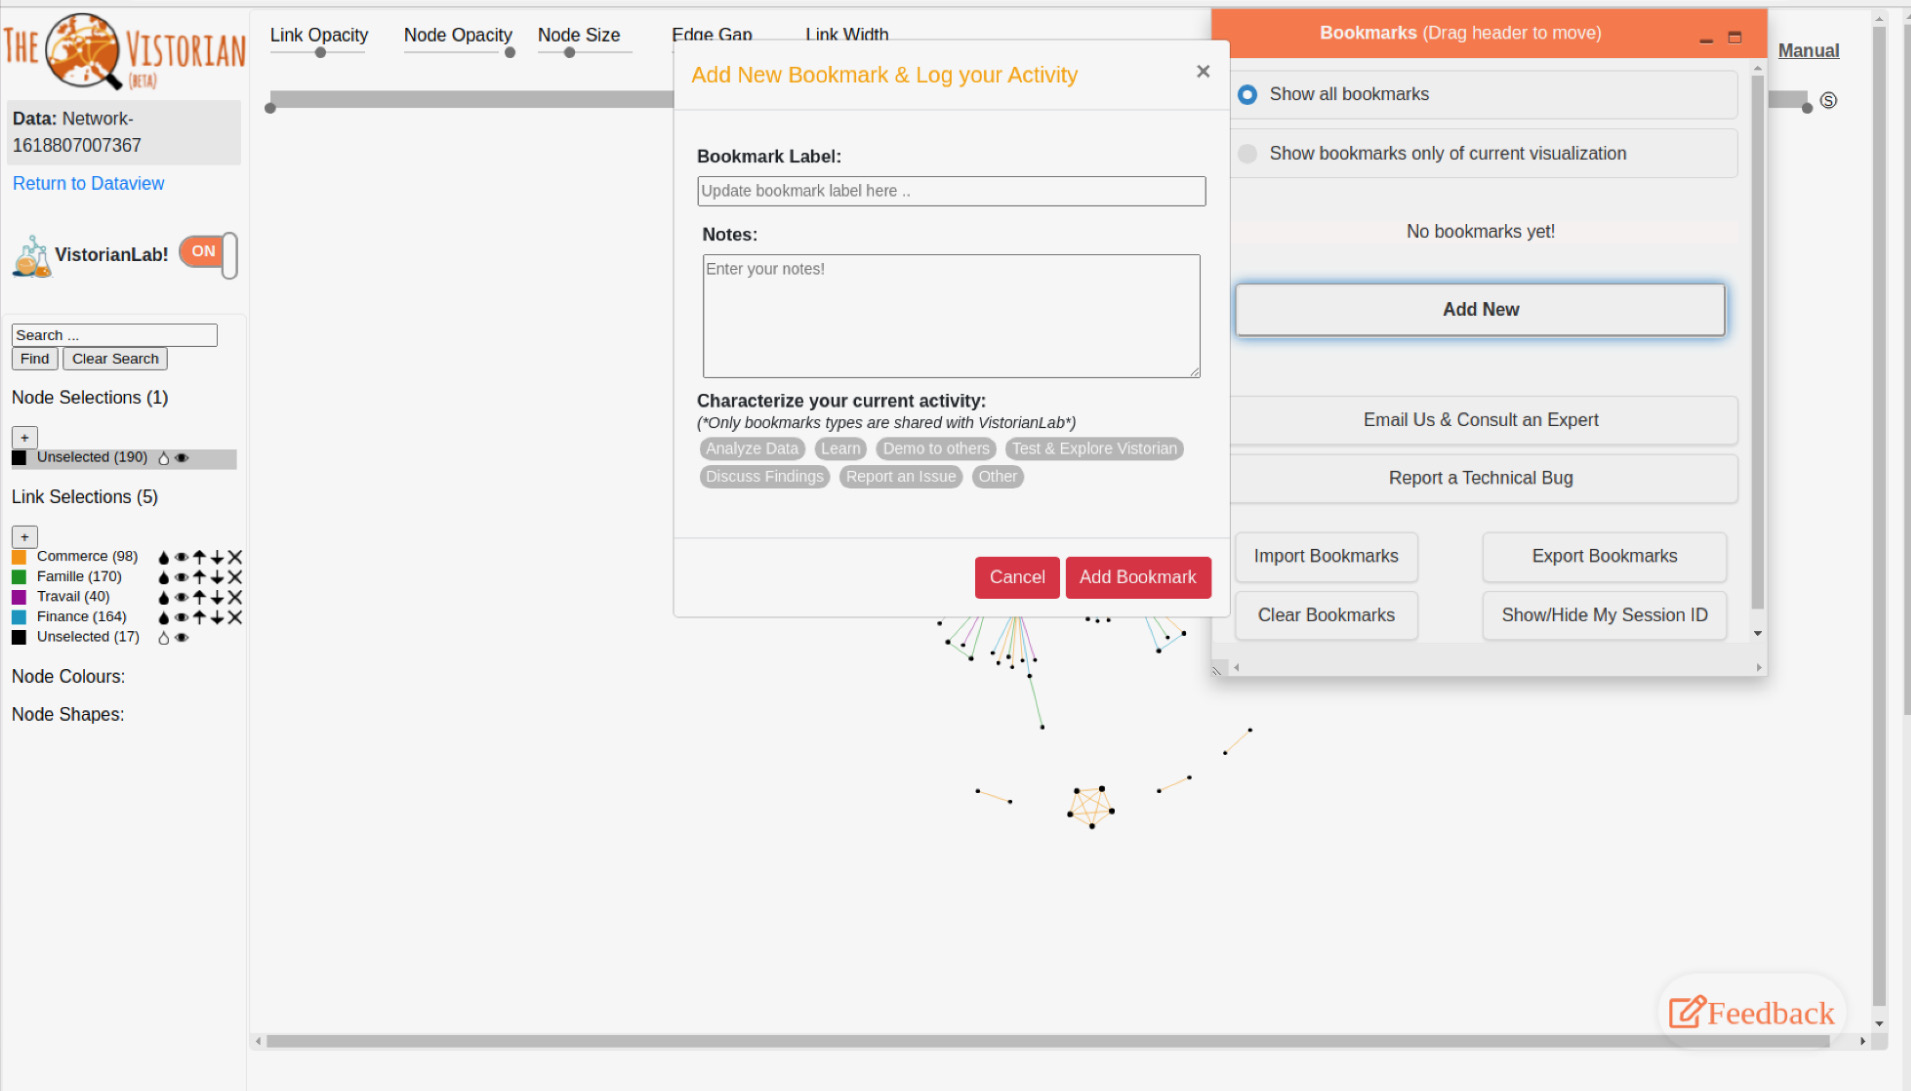
- Create your first bookmark with the network’s initial state: Now click on [Add New] button to add a new bookmark or with the keyboard shortcut combination [Ctrl+Shift+A]. This will capture the initial state of your network automatically and show the [Add New Bookmark & Log your Activity] form. Now, enter your bookmark’s description by entering the value of each field. The following values illustrates an example; you can enter your own as well:
- Title: first bookmark
- Notes: creating first bookmark of Nodelink network.
- Characterize your current activity: (required field) for example, choose [Analyze Data] ⇒ then, a group of checkboxes will appear, choose any of them (ex. Review Data Quality + Compare different visualizations).
- Then click on the [Add Bookmark] button.
-
It might be helpful to minimize the bookmarks pane and change its position to perform the following steps. You can do such a thing by clicking on the orange bar and dragging the pane to your preferred location.
- Changing Node-Link properties values: Now, try to set the visualizations’ properties with those values as following
- Drag start time of the timing slider: Dec 26 1674
- Drag end time of the timing slider: Apr 26 1675
- Drag link opacity closer to the right side, node opacity knob to the left side, and node size to the right of their slider.
- Drag edge gap slider to the right side.
- Drag link width slider to the most left side
- Set the labelling type to : automatic or any of your choice.
- Hover over link(s)/node(es) to read the nodes and links labels.
- Create your second bookmark: after creating a Node Link visualization you can explore the network by playing with features provided (ex. Link opacity, Node opacity ,..). Now click on [Add new] button to add a new bookmark with the values :
- Title: Second bookmark Dec-Apr 74-75
- Notes: Exploring how to work with Vistorian and bookmarks.
- Characterize your current activity: [Test & Explore Vistorian]
- Then click on the [Add Bookmark] button.
- Setting Node-Link properties values: Now, try to set the visualizations’ properties with those values as following
- Drag start time of the timing slider: Nov 24 1665
- Drag end time of the timing slider: Jul 30 1687
- Drag link opacity, node opacity, and node size to the right of their slider.
- Drag edge gap slider to the left side.
- Drag link width slider to the middle
- Set the labelling type to : automatic.
- Hover over link(s)/node(es) to read the nodes and links labels.
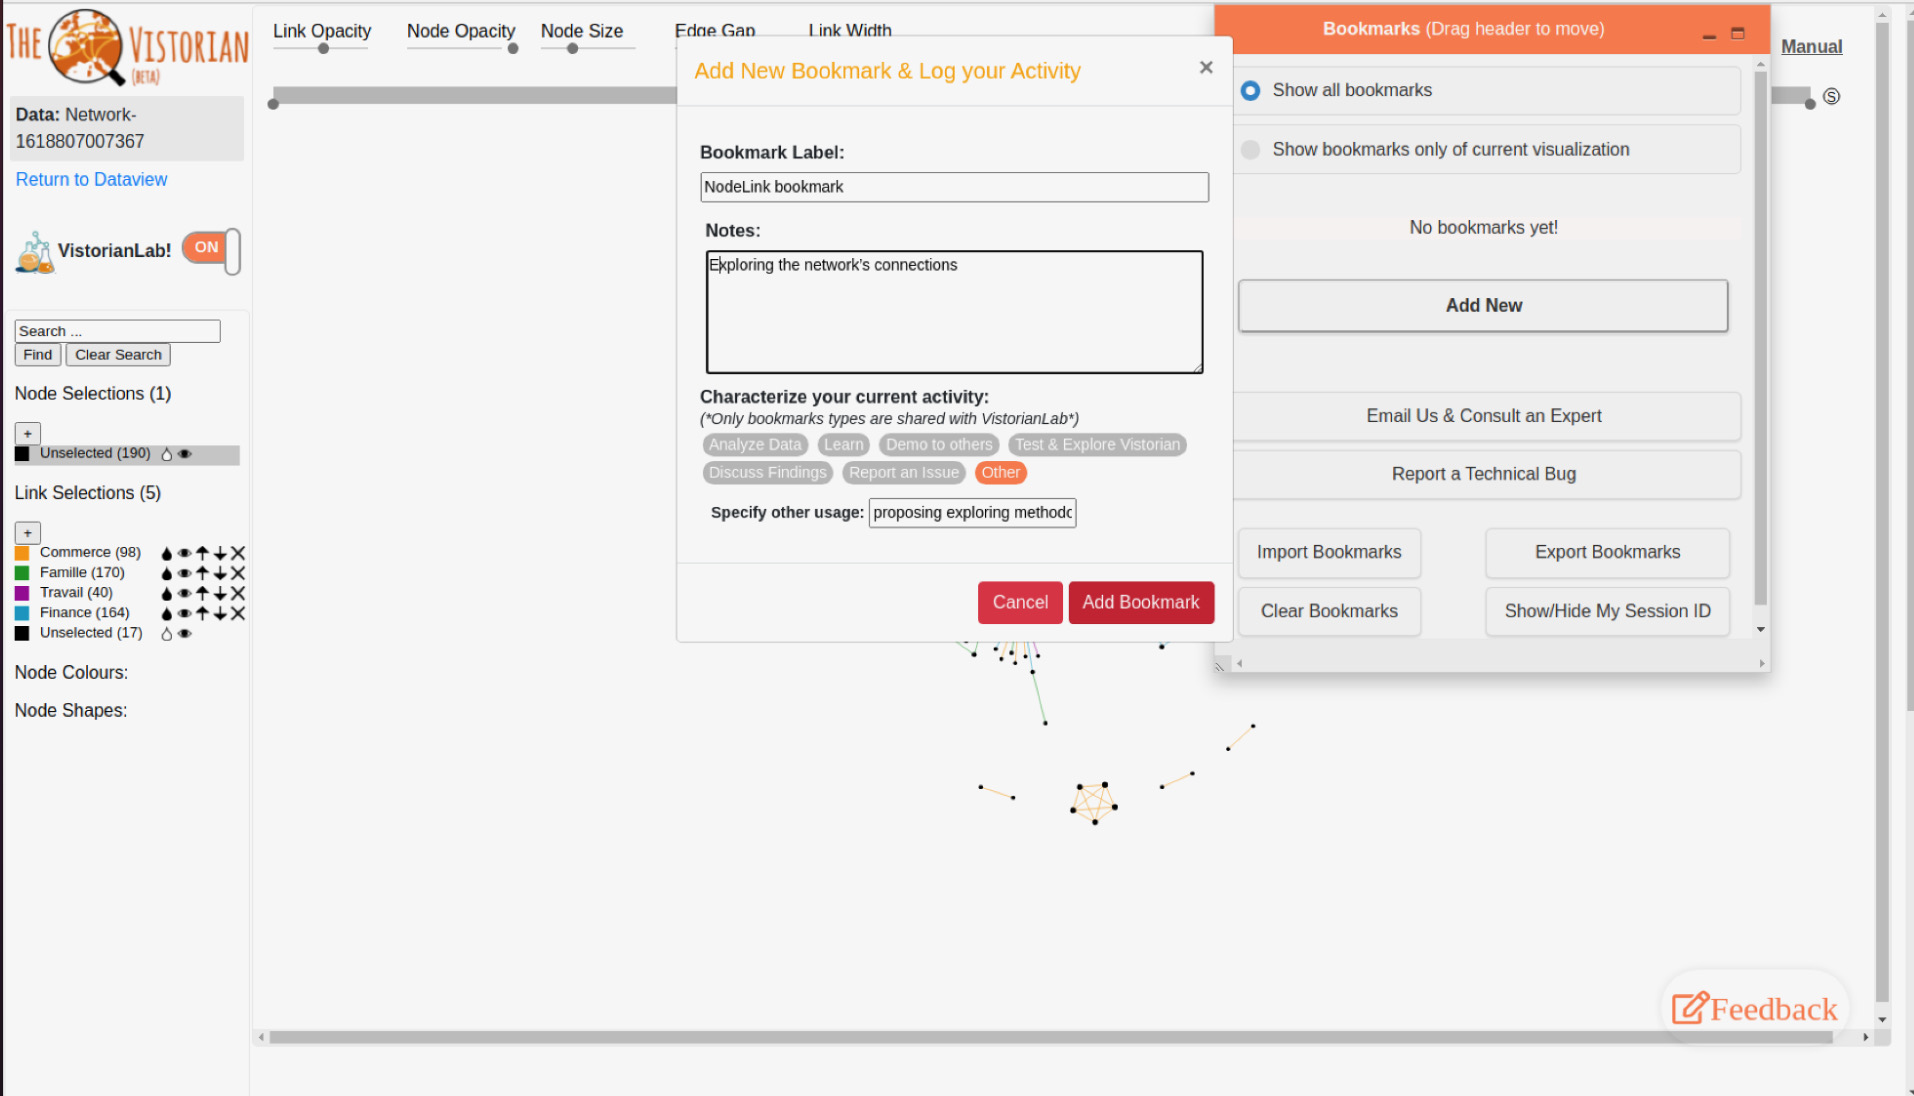
- Create your third bookmark: click on [Add new] button to add a new bookmark with the values (This will capture the initial state of your network automatically) :
- Title: NodeLink bookmark
- Notes: exploring the network’s connections.
- Characterize your current activity: [Other] ⇒an additional textbox will appear, enter any type of your choice: (e.g proposing exploring methodology )
- Then click on the [Add Bookmark] button.
-
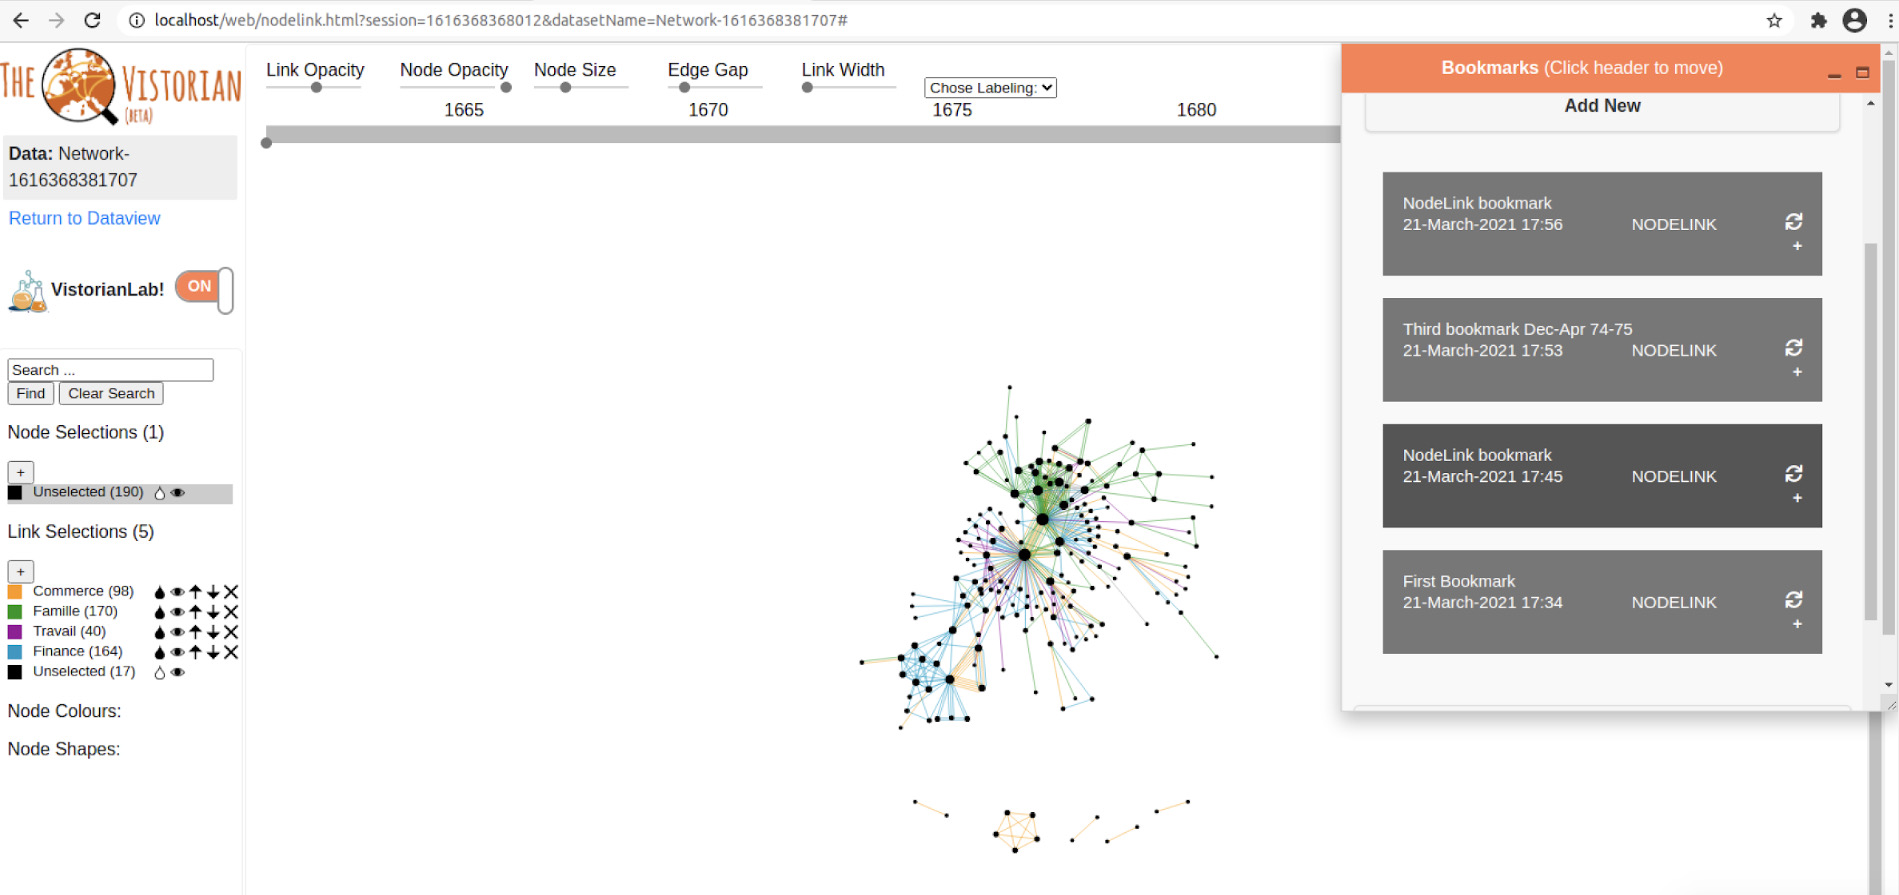
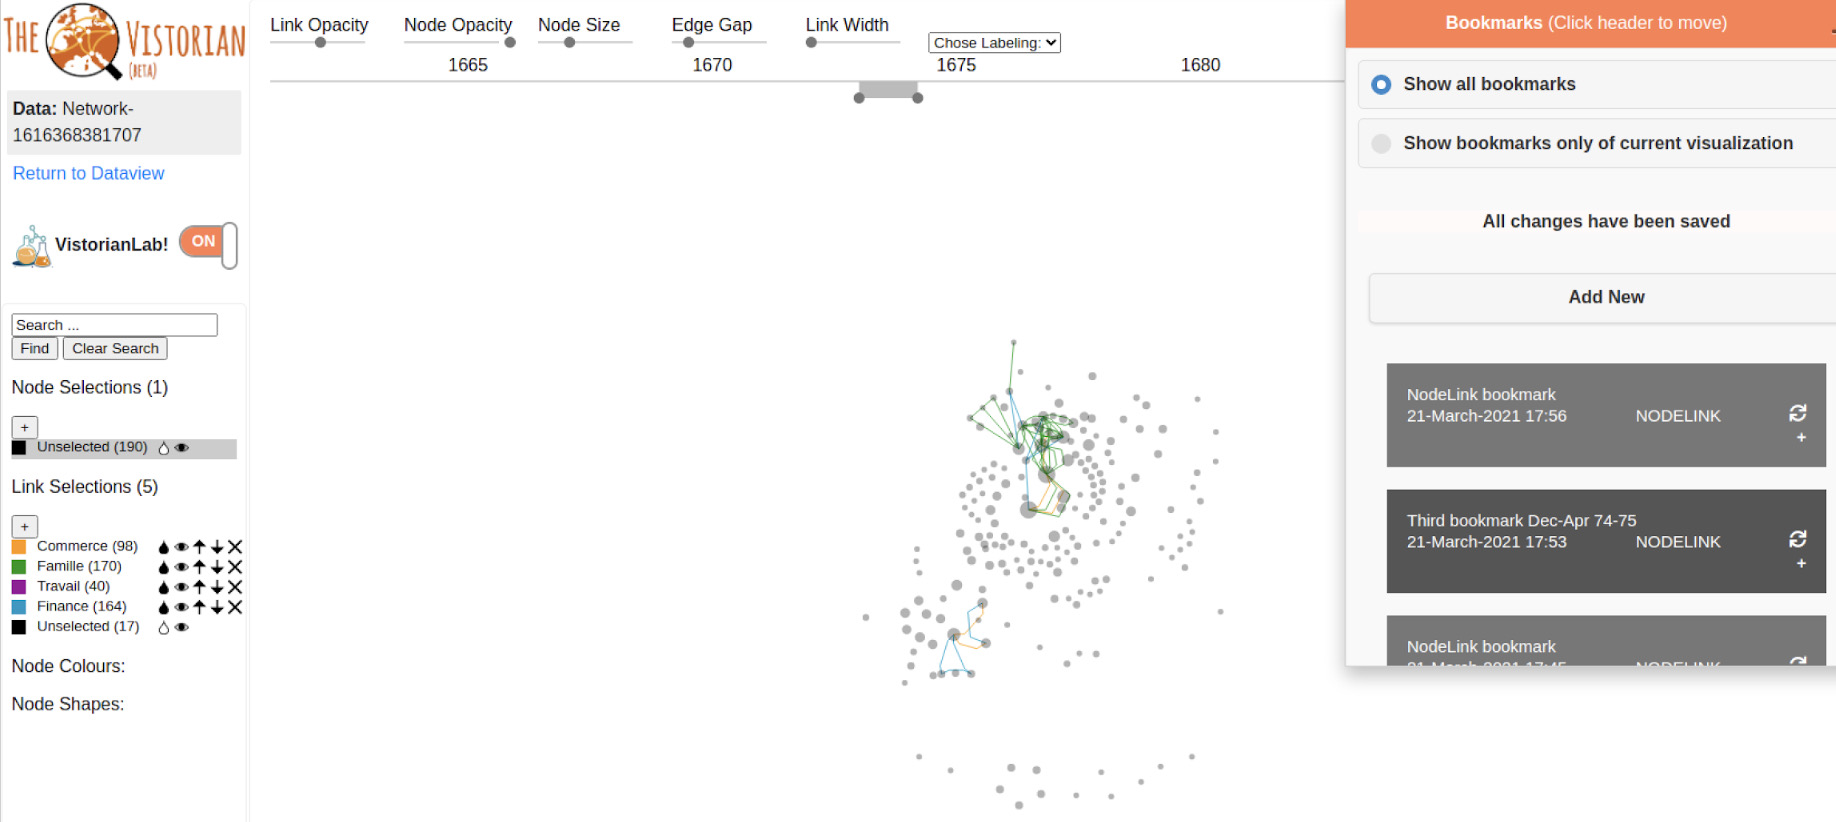
Switching between states: Now, try to click on the [Restore] button on each of the bookmarks you have created and observe the states you have saved.
You can observe and see how the network’s state changes each time you click the [Restore] button located in the bookmark header. This is based on the selected bookmark values such as what the following images shows:
- Provide general feedback [Feedback] button: on the bottom-right corner below, click on the [Feedback] button and provide your feedback by selecting what characterizes your work and/or written feedback.
 ⇒
⇒
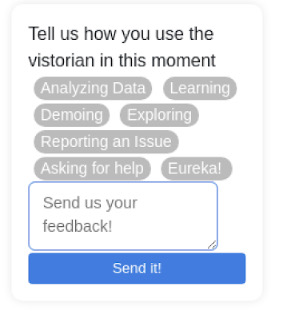 Try the following:
- Select the type to be : Asking for help
- Enter any feedback of your own on the textarea provided. For example, please add an exit survey to provide you with more feedback about our experience.
- Using the Map Visualization: Go back to the Vistoian “Data view” tab in your browser. In order to use the map visualization you need to:
- Specify the source and target locations by selecting the type of the column in the dataview page.
- Minimize the bookmarks’ pane to have a large view of the current page.
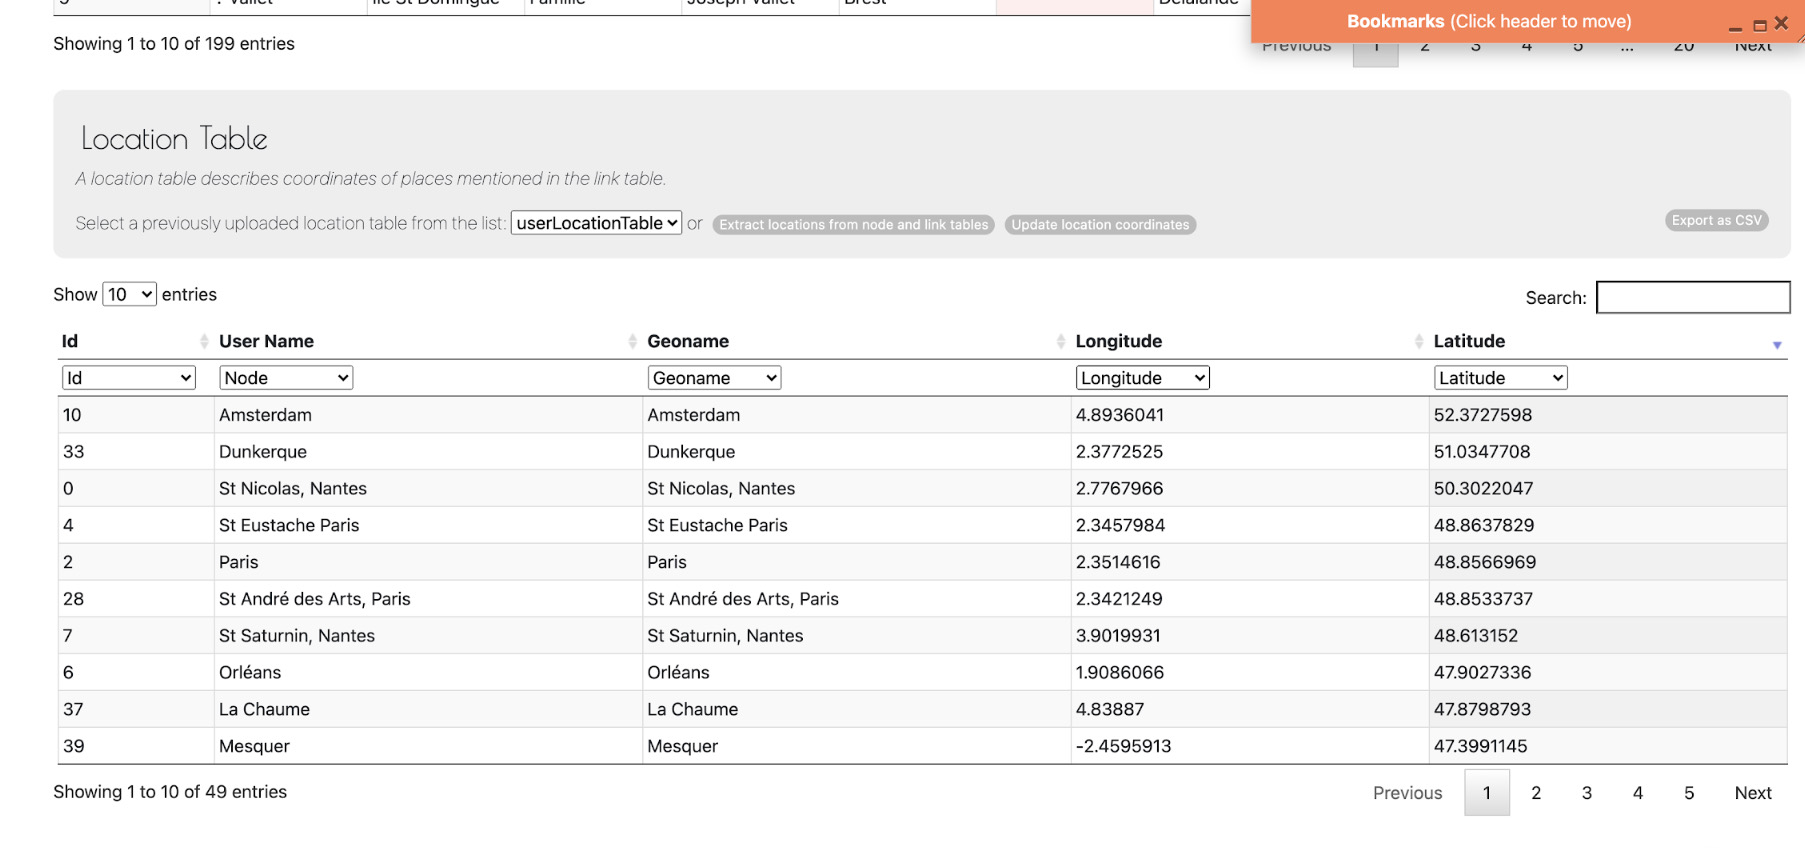
- Scroll down in the dataview page and click on the [Update Location Coordinates] button in the location table populated below.(L)
- P.S. if longitude and latitude values don’t show-up in the location table. Refresh the page by clicking on the browser’s [Reload] button to fill the table with the location values ias the figure below shows.
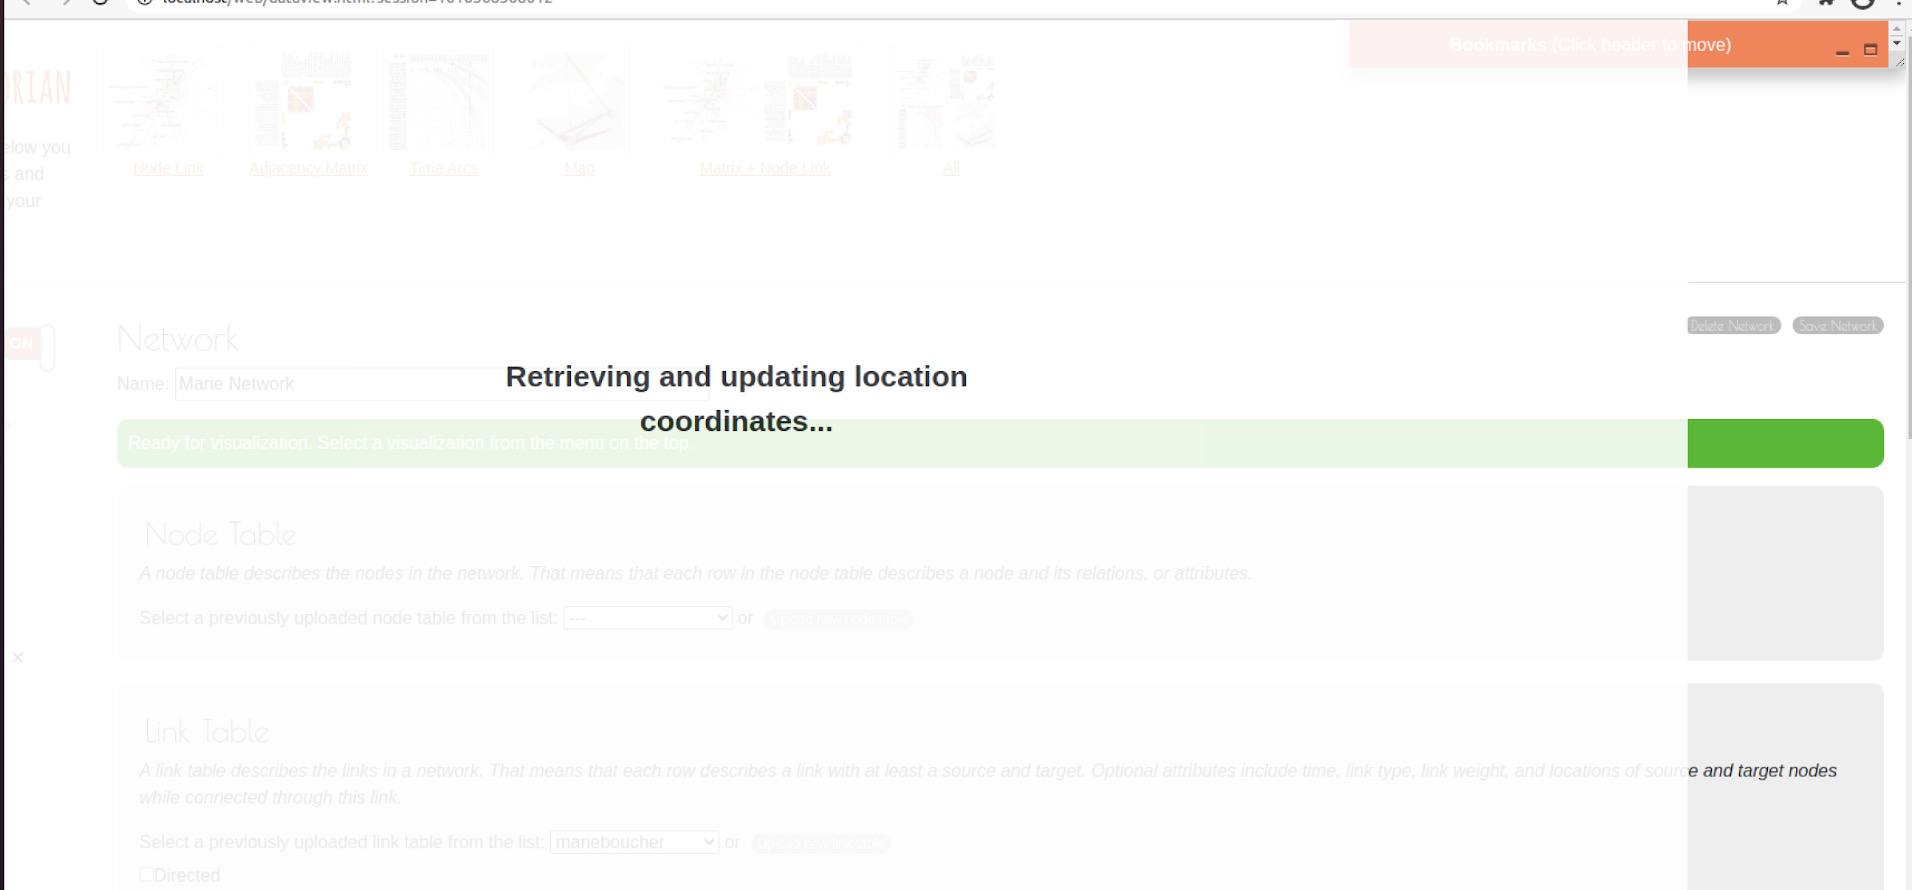
- It will show the following screen: with a notice of (Retrieving and updating location coordinates). Click anywhere in the page and refresh the page if it doesn’t disappear and populate your location table with coordinates.
-
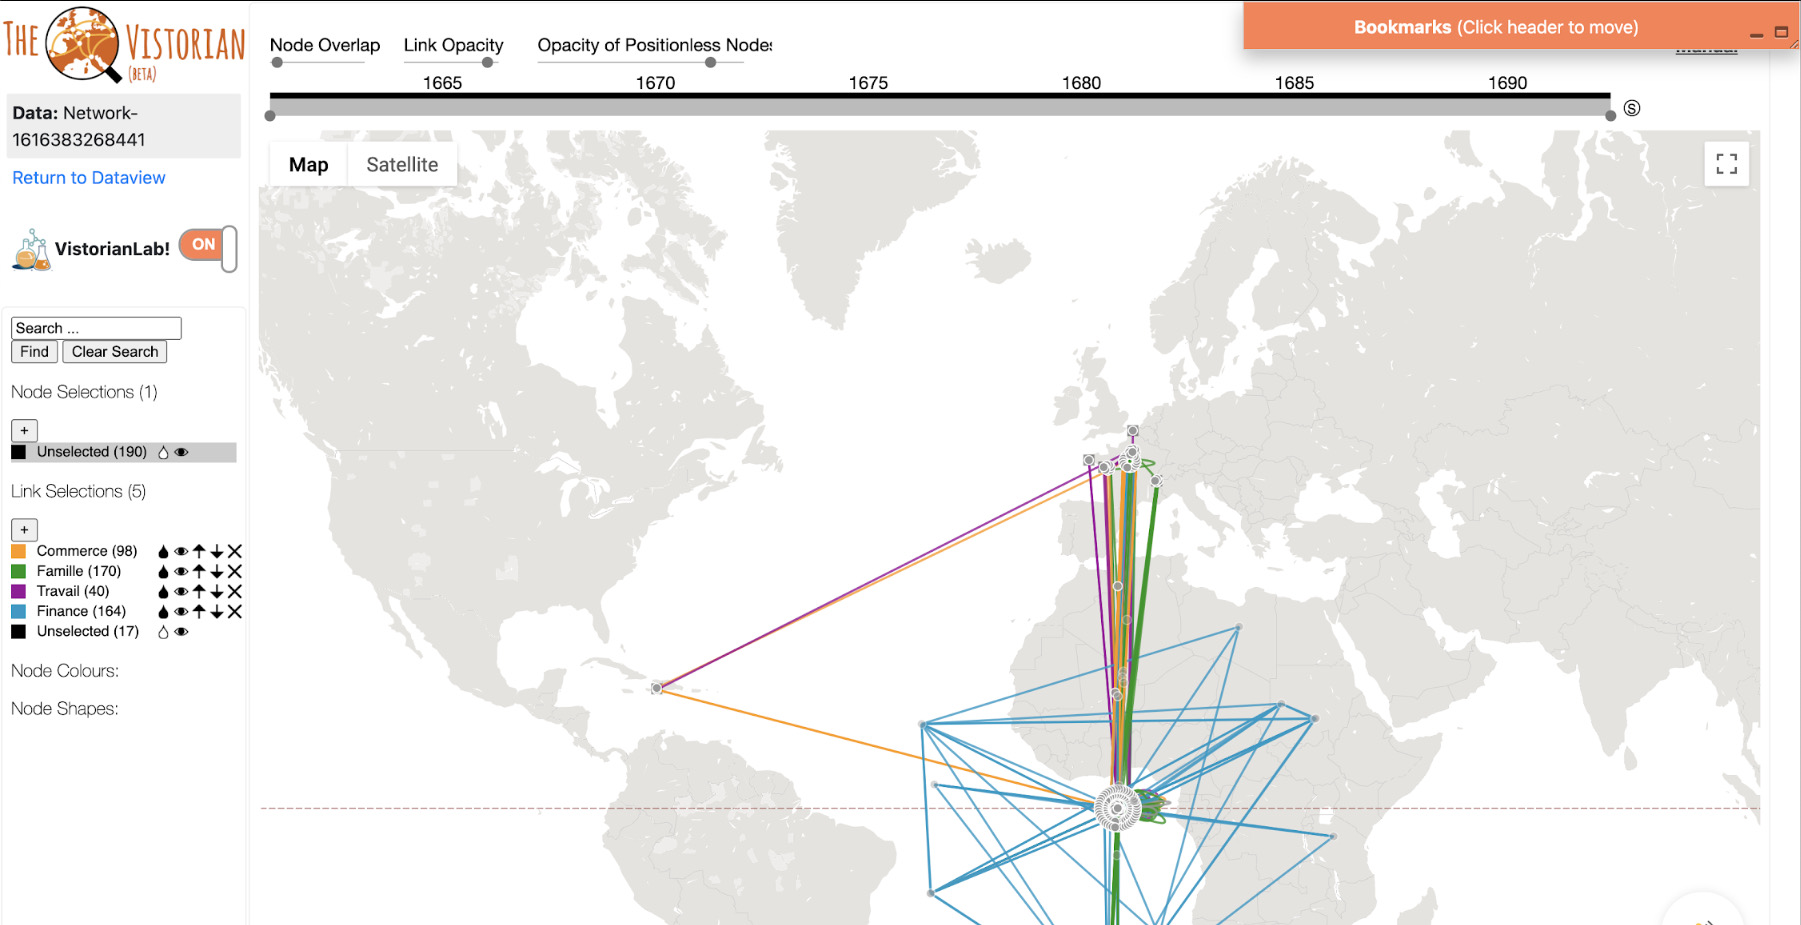
Map Networks: now click on the map link in the upper part of the dataview page. A new window will open showing your network map such as in:
- Create your fourth bookmark: In the map network page, click on [Add new] button to add a new bookmark with the values (This will capture the initial state of your network automatically) :
- Title: Map bookmark
- Notes: examining the locations and the link between nodes.
- Characterize your current activity: [Demo to others].
- Then click on the [Add Bookmark] button.
-
Setting Map properties values: Now, try to set the visualizations’ properties with those values as following Drag start time of the timing slider: Oct 04 1670 Drag end time of the timing slider: Sep 07 1680 Drag the switch of Node Overlap to the left side of the slider. Drag the switch of the link opacity to the right side of the slider. Drag the switch of the Opacity of Positionless Nodes to the middle of the slider.
- Create your fifth bookmark: click on [Add new] button to add a new bookmark with the values (This will capture the initial state of your network automatically) : Title: Map from 1670 to 1680 Notes: correct nodes with missing cities (positionless nodes) . Characterize your current activity: [Report an issue]. Then click on the [Add Bookmark] button.
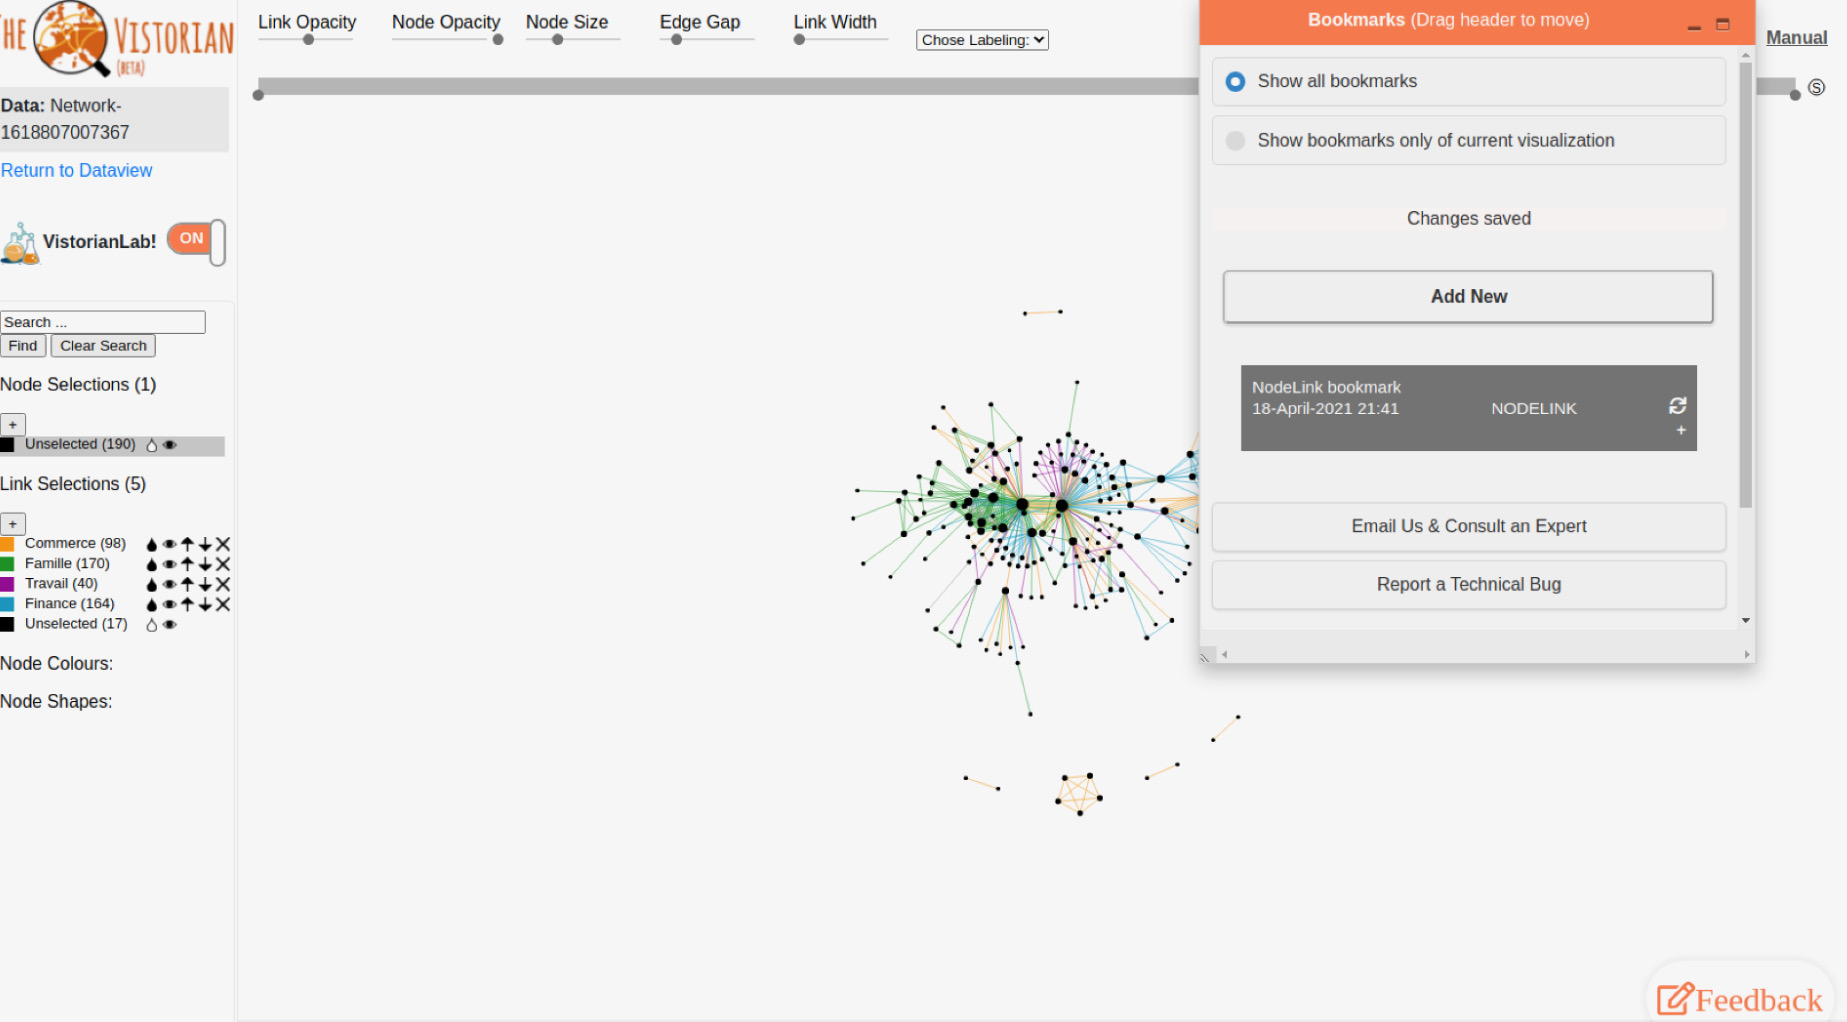
The bookmarks’ pane will look something like this:
-
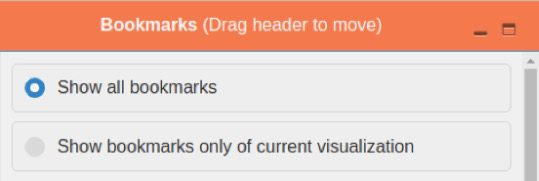
Changing the bookmarks’ view: At the top of the bookmarks’ pane you have two radio buttons that you can select from: the first one will display all of your saved bookmarks, the second one will display the bookmarks of the current view only. You can toggle between those two views at any time.(L) Try this on any of the Vistorian pages (e.g. Node-Link, map, .. )
-
Creating the TimeArchs (DynamicEgo) Visualization: return to the dataview page and click on the Time Arcs link: This will open a new page of the Time Arcs, you can hover over links and change the order of the labels (Choose the value of: Alphanumerical) Set time to : Jan 1 1975 to Jan 1 1980
- Create your sixth bookmark: click on [Add new] button to add a new bookmark with the values (This will capture the initial state of your network automatically) :
- Title: Dynamic Ego 1975-1980
- Notes: order values alphanumerically.
- Characterize your current activity: [Analyze Data] (Check the option : Retrieve specific details)
- Then click on the [Add Bookmark] button.
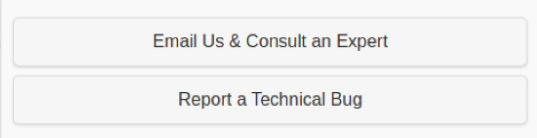
- Click on the [Report a Technical Bug/Email Us & Consult An Expert] button: by clicking on this button, an email template will popup through your email client. You can also use the keyboard shortcut combinations [Ctrl+Shift+U] / [Ctrl+Shift+E] to start these tasks. Complete the email by describing your request and email us.
- P.S. For any further support, upon your wishes you can provide the team with the session ID. This will help to identify the log of events of your session and provide you with the suitable support upon your request and needs.
-
Creating the Matrix Visualization: return to the dataview page and click on the matrix link This will open a new page of the matrix, you can hover over links and change the: order of the labels (Choose the value of: Node Degree) Zoom: set the slider to middle value Set start-end date: Jun 20 1967 to Mon 18 1964
- Create your seventh bookmark: click on [Add new] button to add a new bookmark with the values (This will capture the initial state of your network automatically) :
- Title: Matrix with Node Degree
- Notes: examining nodes’ structure.
- Characterize your current activity: [Other] (and set text to : classification)
- Then click on the [Add Bookmark] button.
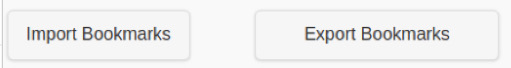
- Export your bookmarks: click on the [Export Bookmarks] button. This will automatically download a copy of your bookmarks in a JSON format file into your default download path.
- Recreating the network and bookmarks:
- Return to the Data view.
- Delete all data: by clicking on the [Empty Browser Cache] button (L)
- Activate the VistorianLab again by switching its button to on.
- Create a new network: by clicking on [New] button in the Networks section (L)
- Click on upload new link table (or select form the dropdown menu if you have already uploaded your data file).(L)
- Click on the [Import Bookmarks] button: select your bookmarks file to be uploaded. This will automatically populate your bookmarks pane with your saved bookmarks values.
-
You can download a small bookmarks sample from: click here
P.S. Importing any file will override any existing bookmarks.
-
Updating a bookmark: Go to the first bookmark you have created and change its type from (Learn) to (Demo to others) Click on the [Save Changes] button.
-
Deleting a bookmark: Go to the second bookmark you have created Click on the [Delete Bookmark] button.
- Creating with Multi-view visualizations: You can repeat the same steps with any other type of the visualizations offered in the data view page and play with the features offered such as:
- NodeLink-Map visualization
- All (Tile) visualizations
- Using help resources:
Visit the home page and explore the help resources provided such as:
- Click on Visualization Manual link
- Click on Demo link
- Click on Data Formatting link
- Click on Github link